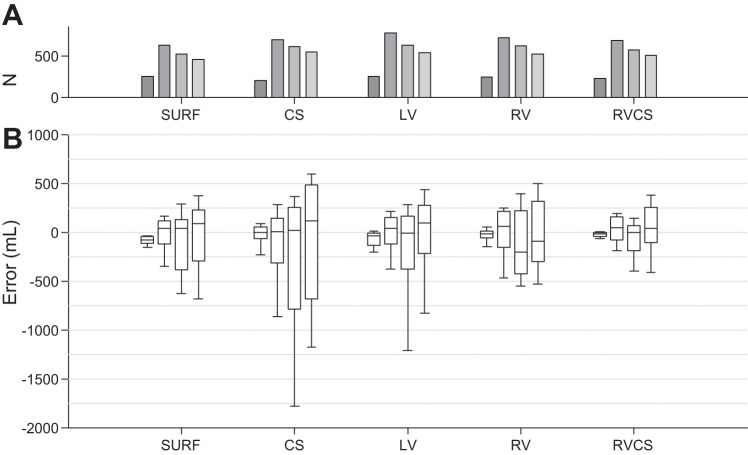
Fig. 5.
A and B: total validation error (true TV − estimated TV) using the minute percent modulation at each of the TVs of 0, 250, 500, and 750 ml compiled over all 10-folds of the cross-validation for the body surface, and intracardiac CS, LV, RV, and RV-CS lead configurations. Overall, the error increases as the TV increases from 0 to 750 ml in all leads. Data are presented as median (horizontal solid line), 25–75th percentiles (box), and 10–90th percentiles (error bars). For each lead and each TV, the total number of cycles (N) used to estimate the error is shown in A (gray bars).

