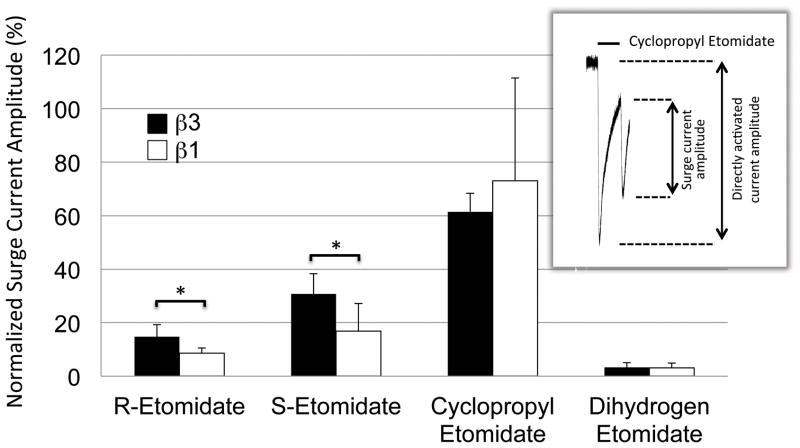
Figure 4.
Normalized surge current amplitude produced by R-etomidate, S-etomidate, cyclopropyl etomidate, or dihydrogen etomidate (all at 1000 μM). Each bar represents the average normalized amplitude (± SD) obtained from 6 separate oocytes. The inset shows a representative current trace recorded upon 30-sec application of 1000 μM cyclopropyl etomidate to α1(L264T)β1γ2L γ-aminobutyric acid type A receptors with the surge and directly activated current amplitudes indicated by the arrows. The normalized surge current amplitude is defined as the surge current amplitude divided by the directly activated current amplitude. In the inset example, this value was 58%. For each receptor subtype, statistical differences among the four drugs was tested using a one-way analysis of variance with Tukey’s multiple comparisons test. This analysis showed that cyclopropyl etomidate produced significantly larger normalized surge current amplitudes than the other drugs (for clarity, this comparison is not indicated in the figure). Comparisons among the other three drugs were not statistically significant. For each drug, a statistical difference between receptor subtypes was tested using a t-test with Walsh’s correction. Both etomidate enantiomers produced larger surge current amplitudes in α1(L264T)β3γ2L versus α1(L264T)β1γ2L γ-aminobutyric acid type A receptors. *, p < 0.05.

