
Figure 2.
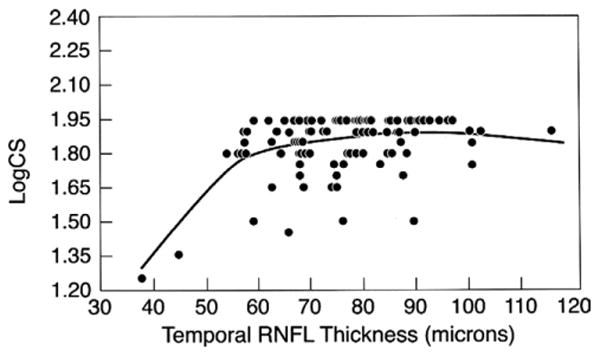
Scatterplot showing logCS vs temporal retinal nerve fiber layer thickness for 102 eyes of 57 HIV-infected individuals without ocular opportunistic infections. Smaller logCS values indicate worse contrast sensitivity.
Official websites use .gov
A
.gov website belongs to an official
government organization in the United States.
Secure .gov websites use HTTPS
A lock (
) or https:// means you've safely
connected to the .gov website. Share sensitive
information only on official, secure websites.
Scatterplot showing logCS vs temporal retinal nerve fiber layer thickness for 102 eyes of 57 HIV-infected individuals without ocular opportunistic infections. Smaller logCS values indicate worse contrast sensitivity.