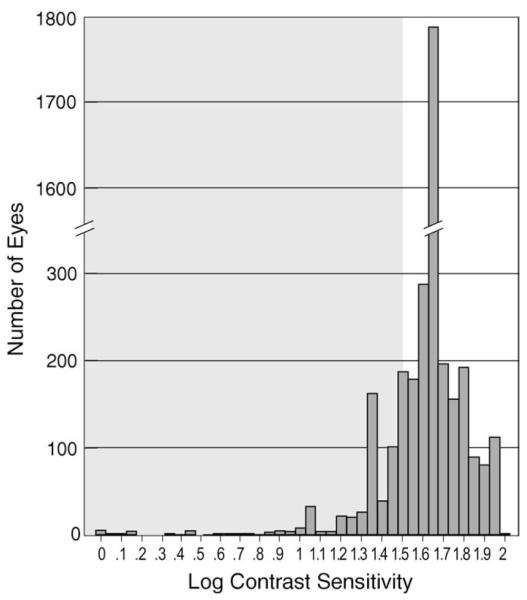
FIGURE 1.
Histogram showing the distribution of contrast sensitivity (CS) values for 3363 eyes of 1691 participants without ocular opportunistic infections at study enrollment (baseline examination) in the Longitudinal Study of the Ocular Manifestations of AIDS. Abnormal CS (shaded area) was defined as logCS <1.5 (the lower 2.5th percentile for a normal control population described by Myers and associates.14 The mode (interrupted bar) was logCS 1.65 (n = 1778 eyes).

