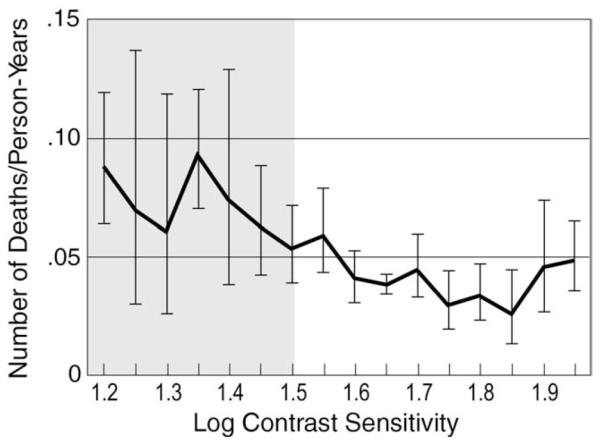
FIGURE 2.

Deaths per person-year of follow-up versus contrast sensitivity (CS) at study enrollment (baseline examination) in the Longitudinal Study of the Ocular Manifestations of AIDS. Vertical bars represent 95% confidence intervals. The shaded area corresponds to abnormal CS (corresponds to the lower 2.5th percentile for a normal control population described by Myers and associates).14
