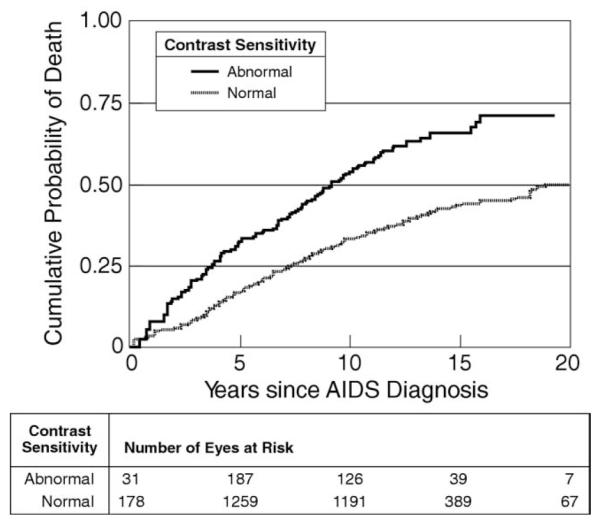
FIGURE 3.

Kaplan-Meier plot showing cumulative probability of death versus interval since diagnosis of AIDS for participants grouped by normal (dotted line) versus abnormal (solid line) CS in the Longitudinal Study of the Ocular Manifestations of AIDS. The risk of death is significantly greater for those with abnormal CS (P < .0001). Abnormal CS was defined as logCS <1.5 (the lower 2.5th percentile for a normal control population described by Myers and associates).14
