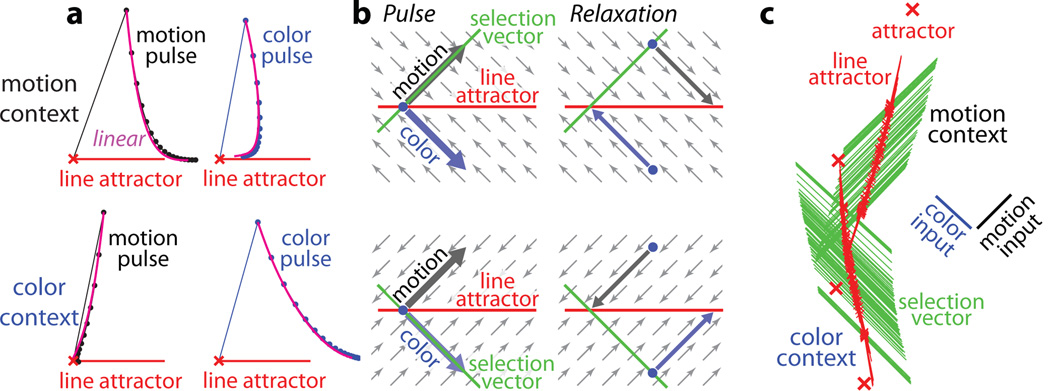
Figure 6. Selection and integration by recurrent dynamics.
a, Average model population response to short (1ms) pulses of motion (left) and color inputs (right) during motion (top) and color contexts (bottom). Motion or color inputs (solid lines) are initiated when the system is steady at one of the identified fixed points (red crosses), and subsequent relaxation back to the line attractor is simulated (dots: 3ms intervals) and averaged across fixed points. The size of the pulses approximately corresponds to the length of the scale bars in Fig. 5. Selection of the relevant input results from the context-dependent relaxation of the recurrent dynamics after the pulse, and is well approximated by the linearized dynamics around the fixed points (magenta lines). Responses are projected into the two-dimensional subspace spanned by the direction of the pulse and the locally computed line attractor (the right zero-eigenvector of the linearized dynamics). b, Explanation of how the same input pulse (left) leads to evidence integration in one context, but is ignored in the other (right). Relaxation towards the line attractor (small arrows) is always orthogonal to the context-dependent selection vector, and reverses the effects of the irrelevant pulse. c, Global arrangement of the line attractor (red) and selection vector (green) at each fixed point. Inputs are selected by the selection vector, which is orthogonal to the contextually irrelevant input (note input axes, right), and integrated along the line attractor.

