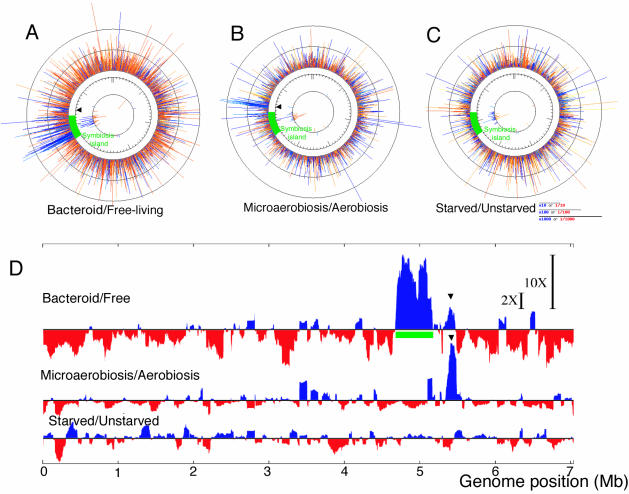
FIG. 1.
Schematic representation of regions with up- and downregulated gene expression on the M. loti chromosome. (A to C) Upregulated (blue lines) and downregulated (red lines) clones in bacteroids (A) and under microaerobic growth conditions (B) and carbon starvation conditions (C). The line length indicates the logarithmic ratio of the hybridization signal to the signal obtained under reference conditions (for panel A, free-living cells; for panel B, cells grown under aerobic conditions; for panel C, unstarved cells). The innermost circle indicates fluctuations in the expression of transposase genes. (D) To compare regions of up- and downregulation (blue and red, respectively) at the genome level, we constructed expression profiles by using 100-kb windows. The arrowhead indicates a region that was upregulated both during symbiosis and under microaerobic conditions. The 2X and 10X bars indicate 2-fold and 10-fold differences, respectively, in expression levels. The symbiosis island (green bar) was located on the chromosome at coordinates 4644702 to 5255766 (18).

