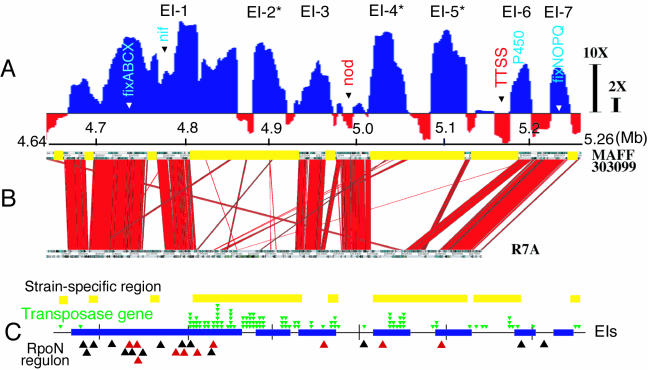
FIG. 2.
EI on symbiosis island. (A) Expression profile constructed by using 20-kb windows to look more closely at the giant region upregulated during symbiosis that corresponded to the symbiosis island and contained seven EIs, which we designated EI-1 to EI-7. EIs in DNA regions specific for strain MAFF303099 are indicated by asterisks. The arrowheads indicate the positions of genes generally accepted to be involved in symbiotic nitrogen fixation. The 2X and 10X bars indicate 2-fold and 10-fold differences, respectively, in expression levels (upregulated, blue; downregulated, red). TTSS, type III secretion system. (B) Synteny between the symbiosis islands of M. loti strains MAFF303099 (18) and R7A (43). Clusters of red lines indicate conserved colinear DNA regions in the two strains. The yellow bars indicate the MAFF303099-specific regions. (C) Positions of the MAFF303099-specific region (yellow bars), the transposase gene (green arrowheads), EIs (blue bars), and active (red arrowheads) and inactive (black arrowheads) RpoN regulons in the symbiosis island of M. loti MAFF303099.

