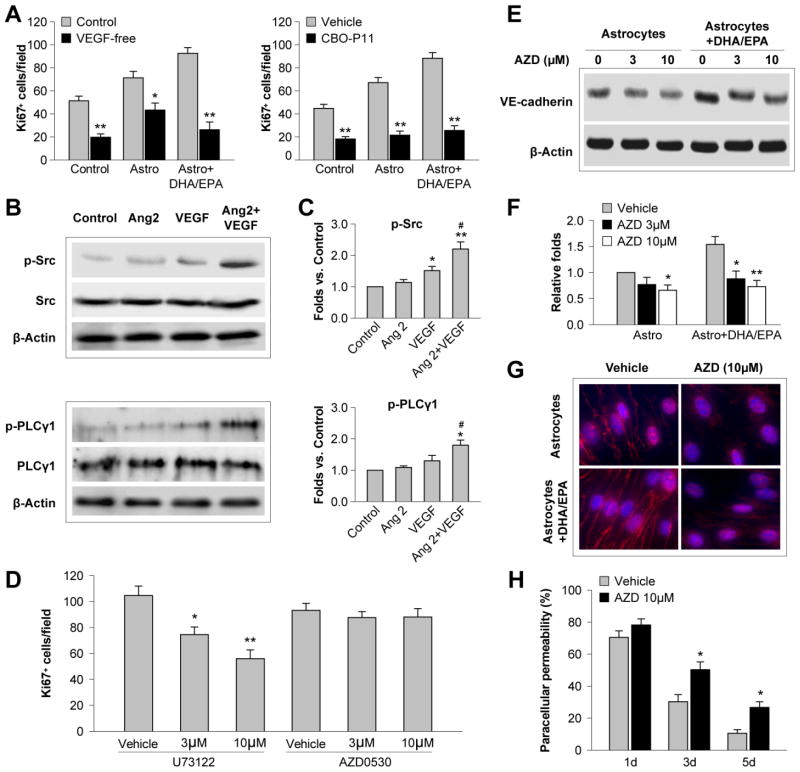
Figure 5. Angiopoietin 2 potentiates VEGF-induced EC proliferation and barrier formation.
A. Primary mouse astrocytes were treated with DHA/EPA (3μM/7μM) or vehicle for 48 h and subjected to 60-min OGD. Astrocytes were then cocultured with ECs in the transwell system, and Ki67+ ECs were counted 3 d later as described in the text. Left: The coculture was maintained in medium with 1 ng/mL VEGF (Control) or VEGF-free medium. Right: The co-culture was treated with the VEGFR antagonist CPO-P11 (10 μM) or vehicle. Data are presented as mean ± SEM from 3 independent experiments, *p≤0.05, **p≤0.01 vs. control. B. Recombinant Ang 2 (20 ng/mL) was added to primary EC cultures without or with VEGF (10 ng/mL). Western blotting was performed 30 min after the treatment to detect phosphorylated Src, total Src, phosphorylated PLCγ1 and total PLCγ1. β-actin was used as an internal loading control. C. Protein expression of p-Src and p-PLCγ1 in ECs was quantified and expressed relative to the control group. Data are presented as mean ± SEM, n=3 independent cultures/group. *p≤0.05, **p≤0.01 vs. control. #p≤0.05 vs. VEGF. D–H. ECs were cultured in the transwell system with DHA/EPA- and OGD-treated astrocytes, as described above. The PLCγ1 inhibitor U73122 or Src inhibitor AZD0530 (3 or 10 μM) were added to the coculture for 3 d. D. The number of Ki67+ ECs was quantified. E–F. Western blotting was performed to detect VE-cadherin in ECs. Expression of VE-cadherin was quantified relative to the vehicle control. G. Representative fluorescent images of VE-cadherin (red) and DAPI (blue) in immunostained ECs. H. Paracellular permeability was measured and expressed as a percentage of vehicle-treated ECs in the absence of astrocytes at 1 d of coculture. Data are presented as mean ± SEM,*p≤0.05, **p≤0.01 vs. vehicle, from three independent experiments.

