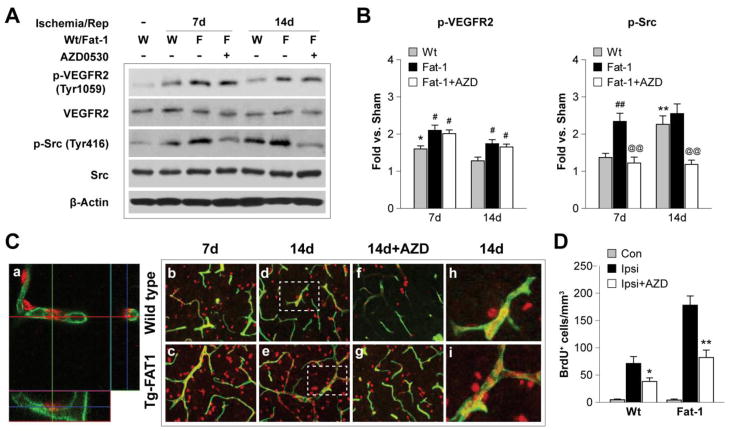
Figure 6. Omega-3 PUFAs enhance post-stroke angiogenesis via VEGF-Src signaling.
A. Representative Western blots of phosphorylated VEGFR2 (Tyr 1059), total VEGFR2, phosphorylated Src (Tyr 416) and total Src in the ipsilateral hemispheres of Wt and fat-1 brains after 7 and 14 d of reperfusion. The Src inhibitor AZD0530 (20 mg/kg) was administered daily by gavage at 3 to 6 d (for the 7-day outcome study) or 3 to 13 d (for the 14-day outcome study) after tMCAO. β-actin was used as an internal loading control. B. Protein levels of p-VEGFR2 and p-Src were quantified and expressed relative to Sham controls. Data are presented as mean ± SEM, n=6–8 animals/group. *p≤0.05, **p≤0.01 vs. Sham. #p≤0.05, ##p≤0.01 vs. Wt. @@p≤0.01 Fat-1+AZD vs. Fat-1. C. Representative fluorescent images of BrdU (red) and lectin (green) labeling in the IBZ following tMCAO. a. Three-dimensional confocal image showing BrdU and lectin double-labeled fluorescence. b-i. BrdU and lectin fluorescent signal in Wt and fat-1 brains, or brains treated with AZD0530 after 7 and 14 d of reperfusion. The BrdU+/Lectin+ dual labeled cells exhibit yellow fluorescence. Dashed boxes in d and e indicate areas that were magnified in h and i, respectively. Note that the BrdU+ cells distribute along the lectin+ vessels. D. Quantification of the BrdU+ cells that are associated with microvessels in the contralateral hemispheres (Con), or ipsilateral hemispheres (Ipsi) of animals with or without AZD0530 treatment at 14 d after tMCAO. Data are presented as mean ± SEM, n=7–8 animals/group. *p≤0.05, **p≤0.01 Ipsi+AZD vs. Ipsi.

