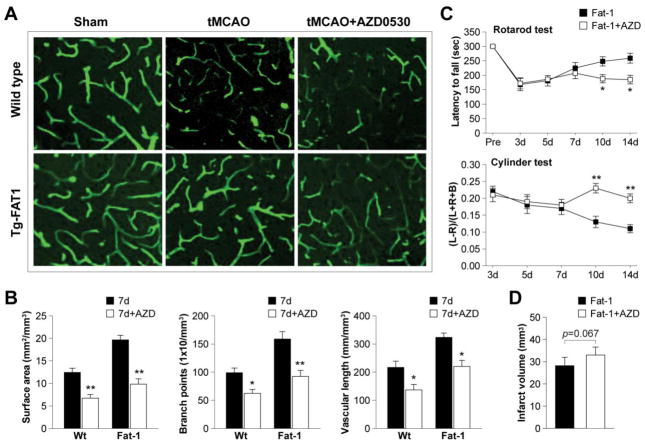
Figure 7. Src inhibition attenuates revascularization and exacerbates neurological outcomes after tCMAO.
A. Representative fluorescent lectin signal in the IBZ of wild type or fat-1 brains after 7 d of reperfusion, with or without Src inhibitor AZD0530. B. Quantification of revascularization in the IBZ by measurement of vascular surface area, branch points or vascular length after 7 d of reperfusion. Data are presented as mean ± SEM, n=7–8 animals/group; *p≤0.05, **p≤0.01 AZD-treated vs. untreated animals. C. Rotarod and cylinder tests during 3–14 d of reperfusion in fat-1 mice or fat-1 treated with AZD0530. Data are presented as mean ± SEM, n=8 animals/group; *p≤<0.05, **p≤0.01 AZD-treated vs. untreated animals. D. Infarct volume in fat-1 mice with or without AZD0530 treatment after 14 d of reperfusion. Data are presented mean ± SEM, n=8 animals/group; p=0.067 AZD-treated vs. untreated animals.

