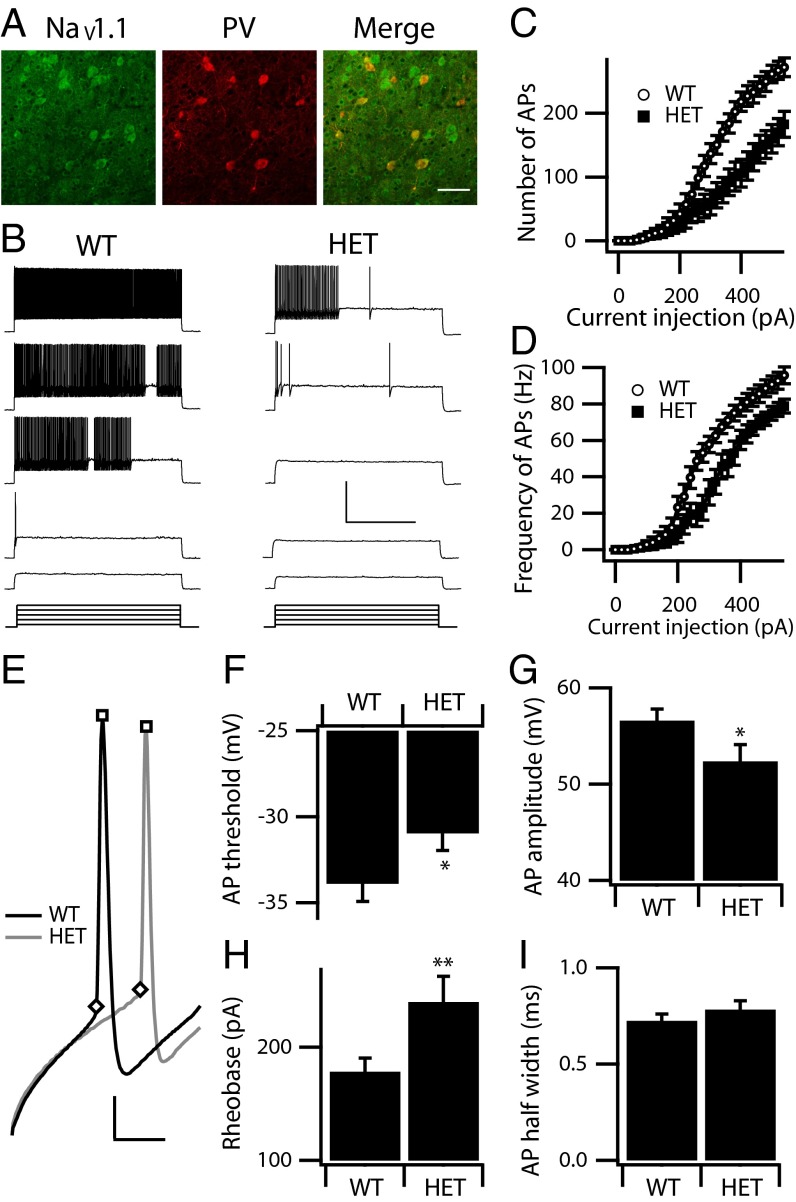
Fig. 1.
Excitability of cortical layer V PV interneurons. (A) Double labeling of cortical layer V PV interneurons from WT animals labeled with anti-NaV1.1 antibody (green) and anti-PV antibody (red). The merged image shows double-labeled PV interneurons in yellow to illustrate the presence of NaV1.1 channels in PV interneurons in cortical layer V. (Scale bar: 100 µm.) (B) Sample whole-cell current-clamp recordings in response to incremental steps of current (3 s, ranging from 140–380 pA), in a WT and a HET PV interneuron. (Calibration: 1 s, 40 mV.) (C and D) The mean number (C) and frequency (D) of APs in response to each step for WT (n = 19) and HET (n = 18). (E–I) Properties of individual WT and HET APs. (E) Expanded and superimposed individual APs from the recordings of WT and HET PV interneurons in B. (Calibration: 2 ms, 15 mV.) (F) Mean AP threshold. (G) Mean AP amplitude. (H) Mean rheobase. (I) Mean AP half width. Significant differences between WT and HET are expressed as *P < 0.05; **P < 0.01.

