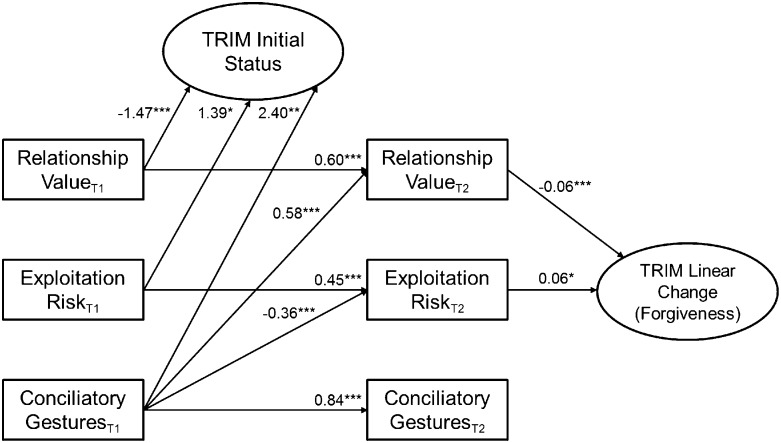
Fig. 2.
Path model for predicting initial status and linear change (i.e., forgiveness) in participants’ TRIM scores. T1 and T2 refer to time 1 and time 2. Coefficients are unstandardized. Variances, covariances, and time points are omitted for clarity (full model results are provided in Table S4). *P < 0.05; **P < 0.01; ***P < 0.001.

