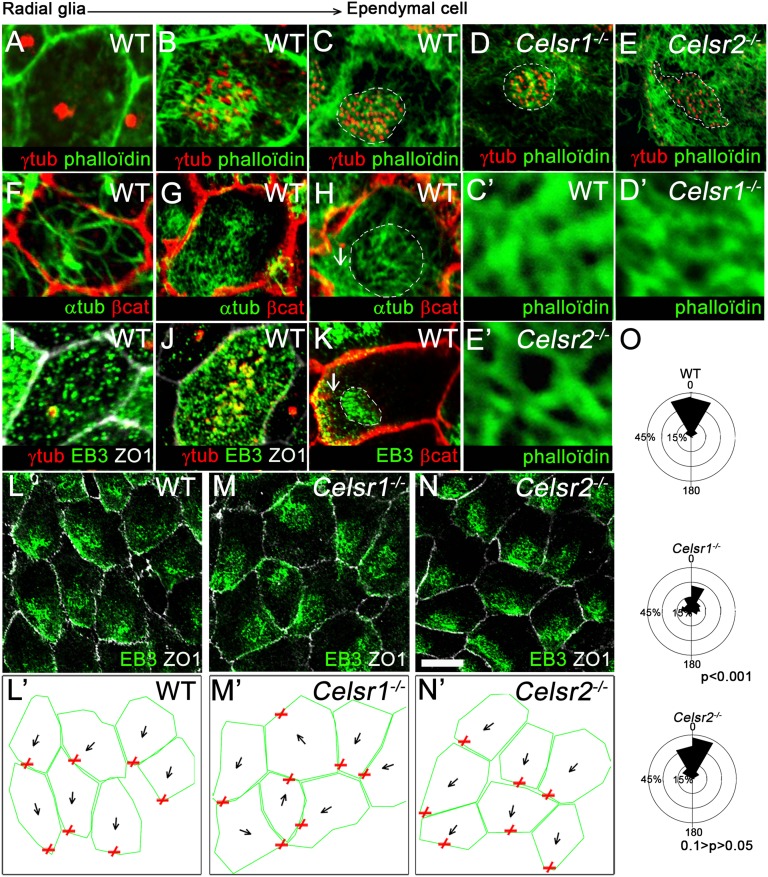
Fig. 5.
Cytoskeletal changes associated with ependymal maturation. (A–E) Cells from (A–C) WT, (D) Celsr1−/−, and (E) Celsr2−/− stained with phalloidin (green) and γ-tubulin (red). (A) In RG cells (P1), actin is restricted to the membrane. (B) In maturing ependymal cells (P5), an actin meshwork arises between BBs. (C) In mature ependymal cells (P21), BBs are ensheathed in actin meshwork. (C′) High magnification of the meshwork of actin. (D and D′) A similar meshwork is observed in Celsr1−/−, whereas (E and E′) Celsr2−/− cells exhibit a loose actin meshwork. (F–K) WT cells stained for (F–H) α-tubulin (green) and β-catenin (red), (I and J) EB3 (green), γ-tubulin (red), and ZO1 (white), or (K) EB3 (green) and β-catenin (red). (F and I) In RG cells, an MT network extends from the primary cilium to the periphery. (G and J) In maturing cells, a meshwork of MT is seen between sparse BBs. (H and K) In mature ependymal cells, a first set of MT is observed underneath BBs (dashed outline), and a second set is observed between the patch and the cell cortex (white arrows). (L–N) P21 LW from (L) WT, (M) Celsr1−/−, and (N) Celsr2−/− stained with ZO1 (white) and EB3 (green). (L′–N′) Outline of the fields shown in L–N. Red × depicts the center of EB3 immunostaining and represents the anchoring point of MT at the cell cortex. Black arrows represent vectors between the cell center and the anchoring point. (O) Circular dispersion of vectors around the mean. Note the broad distribution of vectors in Celsr1−/− (n = 373 cells in WT, n = 401 cells in Celsr1−/−, n = 302 cells in Celsr2−/−; three animals for each genotype; Watson U2 compared with WT: Celsr1−/− = 3.271, P < 0.001; Celsr2−/− = 0.195, 0.1 > P > 0.05). (Scale bar: A, F, and I, 3 µm; B, G, H, J, and K, 6 µm; C′–E′, 1 µm; L–N, 15 µm.)

