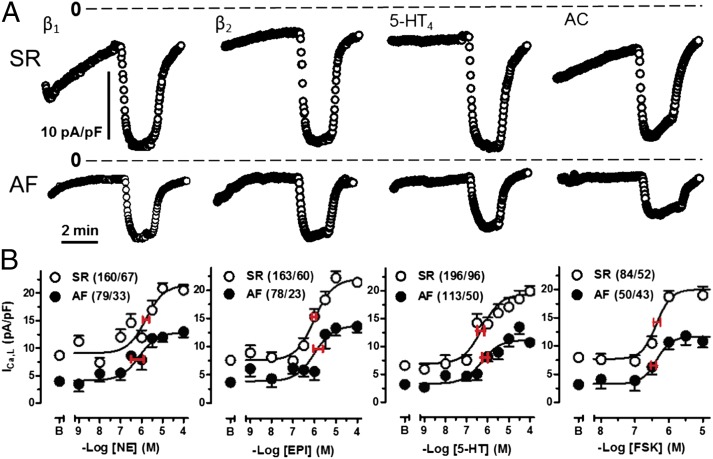
Fig. 3.
Similar reductions in the ICa,L response to NE, EPI, 5-HT, and FSK in AF. (A) Representative plots for ICa,L in response to the agonists (100 µM) and FSK (10 µM) in myocytes from patients with SR or AF. Dotted line indicates 0 current level. (B) Concentration-effect curves for the agonists and FSK. Red horizontal lines through the midpoint of the curves are SEM of –logEC50s. Each data point represents mean values ± SEM in cells/patients. As reported previously (4), basal ICa,L was decreased in myocytes from patients with AF compared with patients with SR.

