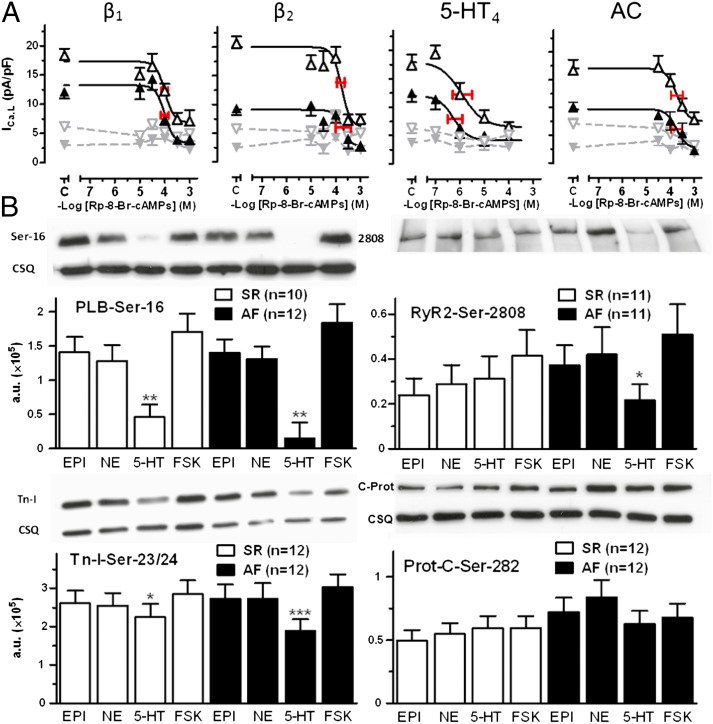
Fig. 4.
Evidence for unchanged PKA function in AF. (A) Concentration-effect curves of Rp-8-Br-cAMPS for the titration of PKA activity of ICa,L at the sarcolemmal Ca2+ channel domain under the influence of 100 µM NE, 100 µM EPI, 100 µM 5-HT, and 10 µM FSK. The midpoint and red horizontal bars in the inhibitory curves for Rp-8-Br-cAMPS represent the concentration for half-maximal inhibition (–logIC50 ± SEM) of the ICa,L responses. Open and closed symbols represent data from patients with SR and patients with AF, respectively. Gray symbols represents basal ICa,L data in the absence of agonists and FSK. Each data point represents mean ± SEM. Total number of cells/patients investigated from patients with SR vs. patients with AF were as follows: NE: 86/18 vs. 57/13; Epi: 103/24 vs. 53/12; 5-HT: 53/15 vs. 71/21; FSK: 39/8 vs. 35/8. C indicates values obtained from control experiments without Rp-8-Br-cAMPS. Note that Rp-8-Br-cAMPS was 2 log units (∼100-fold) more potent in inhibiting the ICa,L response to 5-HT compared with the responses to the catecholamines and FSK. (B) Western blots of PLB-Ser-16, RyR2-Ser-2808, Tn-I-Ser-23/24, and Prot-C-Ser-282 phosphorylation caused by agonists and FSK. Data in columns are from atria with four trabeculae of the same patient with SR (open columns) or patient with AF (black columns). *P < 0.05, **P < 0.01; ***P < 0.001 for the responses to 5-HT compared with the responses to FSK. Phosphorylation responses are shown as mean values ± SEM in arbitrary units (a.u.). CSQ, calsequestrin. NE, EPI, 5-HT, and FSK caused similar PKA-catalyzed phosphorylations in patients with SR or AF. Responses to 5-HT tended to be smaller than responses to NE, EPI, and FSK.

