
Fig. 2.
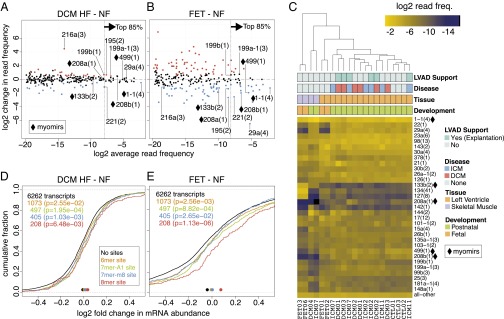
miRNA cistron abundance changes and target gene regulation in failing and fetal myocardium. (A and B) Relative changes in miRNA cistron abundance compared with nonfailing postnatal hearts. Cistrons with a false discovery rate (FDR) of <10% are colored red if up- regulated and blue if down-regulated. Cistrons contributing to the top 85% sequencing reads are to the right and residual cistrons to the left of the dotted vertical line. Labeled in both A and B for comparison are (i) cistrons consistently changed in DCM and ICM HF, (ii) myomirs, and (iii) mir-216a(3) and mir-29a(4) due to their large differences. (C) Unsupervised hierarchical clustering of miRNA cistrons representing the cumulative top 85% miRNA sequence reads with residual cistrons represented as “all–other” at the bottom of the heatmap. The row dendrogram has been omitted. The column labels at the bottom represent the unique IDs for each subject; demographic details on the individual subjects and for each sequencing sample can be found in Dataset S1 (Tables 34 and 35). (D and E) Cumulative distribution function (CDF) showing the changes in mRNA abundance (x axis) for transcripts with different target sites (colored) for family miR-1-1(3) in the 3′UTR compared with transcripts without a site in the 3′UTR (black line). Colored points at bottom of the graph indicate the median of the CDF; P values are from a one-sided Kolmogorov–Smirnov test.