
Fig. 4.
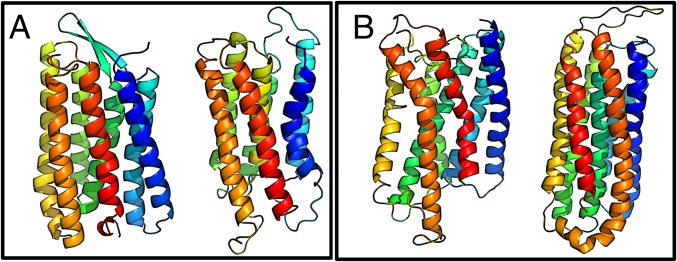
Example structure prediction results from simulations using input topology and secondary structure information derived from bioinformatic sequence-based predictions. (A) 1PY6, Bacteriorhodopsin. (B) 1U19, Rhodopsin. In A and B, The experimental structures are shown on the left, and the simulated structures are shown on the right. Color is used to indicate the amino acid index along the chain.