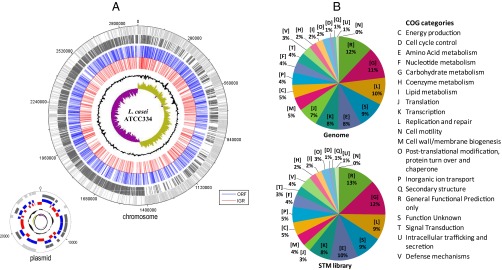
Fig. 1.

Analysis of transposon insertions in the genome of the 9250 L. casei mutants. (A) Genome atlas of transposon insertions. Circle 1: genes on the positive strand in light gray; circle 2: genes on the negative strand in dark gray; circle 3: disrupted genes in blue; circle 4: disrupted IGRs in red; circle 5: GC content; circle 6: GC skew. (B) Relative abundance of cluster of orthologous groups (COG) functional categories of genes in the L. casei genome and in the disrupted genes of the STM library. Hits found in COG represent 68.3% of the genome and 69% of the disrupted ORFs of the STM library.
