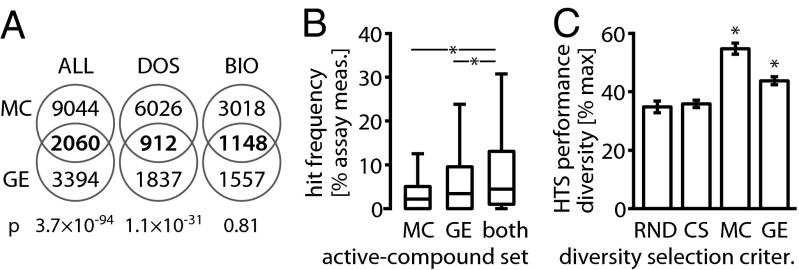
Fig. 5.
MC and GE profiling have overlapping yet distinct hit sets. (A) Venn diagrams of the MC and GE hit sets. Although the majority of compounds are identified by only one of the methods, low P values (Fisher’s exact test) indicate a nonrandom overlap between two hit sets. Both MC and GE identify a large fraction of the BIO collection as hits; thus even high overlap is not significant (SI Appendix, Table S5). (B) Boxplots of HTS hit frequencies (HF, defined in Fig. 3) for active compounds tested in both the MC and the GE study. MC, hits identified based on cell-morphology profiles; GE, hits identified based on gene expression profiles; both, hits identified by both MC and GE. The intersection of the sets of active compounds from the MC and GE assay shows even stronger enrichment for compounds with high HF [median(HFboth) = 4.41%] than either set of actives alone [median(HFMC) = 2.14%; one-sided Wilcoxon PMC = 1.4 × 10⁻¹⁴; median(HFGE) = 3.39%; PGE = 1.9 × 10⁻³]. This indicates that the MC and GE assays tend to agree on compounds that are active in multiple HTS assays and possibly even promiscuous (SI Appendix, Table S6). Asterisks indicate significant HF increases. (C) When direct comparison was made on the intersection of the MC and GE test collections (n = 904), we observed higher HTS performance diversity than random selection for selection based on both MC (Wilcoxon P = 2.9 × 10−165) and GE profiles (P = 7.1 × 10−165) when selecting about a third of the test collection (nsub = 320). Asterisks indicate a significant diversity increase over RND.

