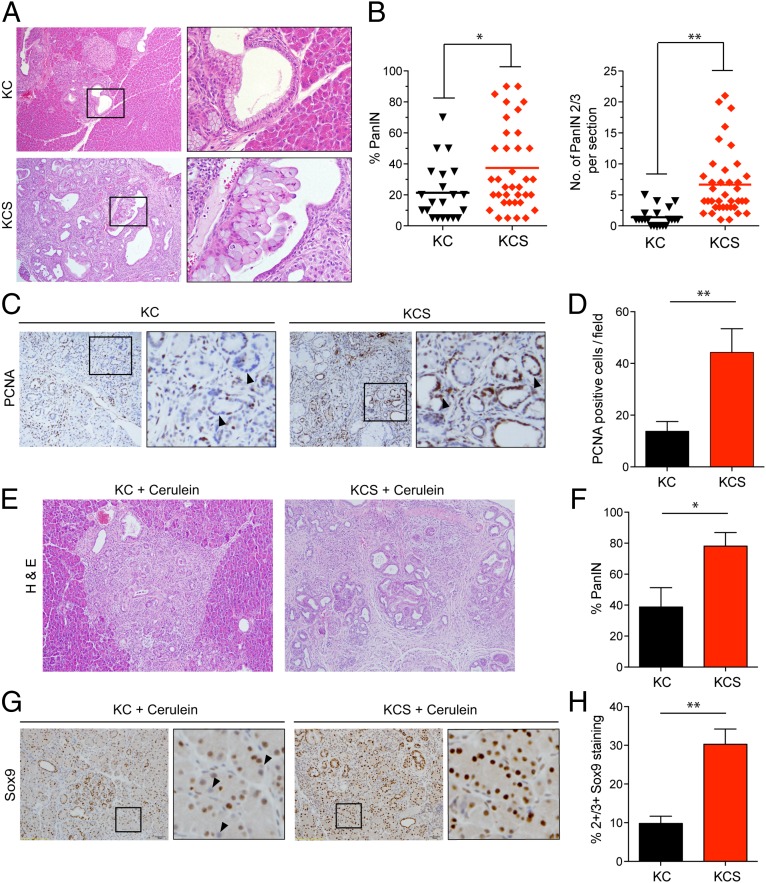
Fig. 1.
Accelerated PanIN formation following Shh loss. (A–D) Analysis of pancreata from KC and KCS mice euthanized at 6 mo of age. (A) Representative histologic images. The boxed regions show PanIN-1A lesions in a KC mouse (Upper) and PanIN-2 in a KCS mouse (Lower). (B) Quantification of percentage of pancreas occupied by PanIN (Left), and number of high-grade PanIN-2/3 lesions per section (Right); *P < 0.02; **P < 0.001. The line indicates the mean value. (C) Immunohistochemistry for PCNA. Boxed regions are magnified at Right. Arrowheads indicate negatively and positively stained nuclei of ductal epithelial cells from KC mice (Left) and KCS mice (Right), respectively. (D) The number of PCNA-positive cells per field (n = 10), from a total of five mice per group was quantified; *P < 0.01. Error bars indicate SEM. (E–H) Eight-week-old KC (n = 4) and KCS (n = 8) mice were treated with cerulein (six hourly injections per day for two consecutive days), and pancreata were collected 1 mo later. (E) Representative histology. (F) Quantification of percentage of PanIN; *P < 0.03. (G) Immunohistochemistry for Sox9 (boxed region magnified at Right; arrowheads indicate negatively stained nuclei in a KC mouse pancreas). (H) Quantification of Sox9 staining (four mice per group, 10 high-power fields (hpfs) per pancreas). The percentage of nuclei scoring as 2+/3+ in staining intensity is plotted. Error bars indicate SEM; **P < 0.001.

