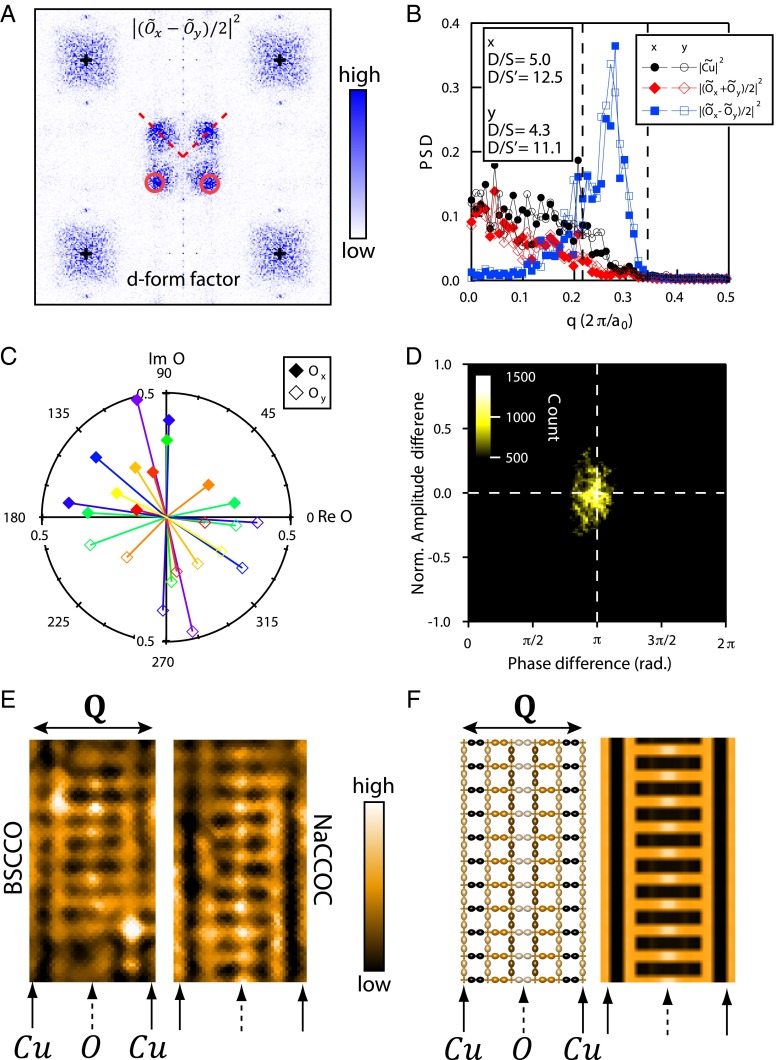
Fig. 4.
d-form factor DW: predominance and robustness. (A) Power spectral-density (PSD) Fourier transforms of R(r) measured only at the Ox/Oy sites yielding ||2. This provides the measure of relative strength of the d-form factor in the DW. (B) Measured PSD is plotted along the dashed line through Q in A and shows the d-form factor component predominates greatly. The measured ratios within the DW peaks surrounding Q are D/S > 5 and D/S′ > 12. (C) compared with for each of a series of representative q within the DW peaks surrounding Q. This shows how, wherever the CuO2 unit cell resides in the disordered DW (Fig. 2A), the relative phase between the Ox and Oy sites is very close to π whereas the differences in magnitudes are close to zero. (D) Two-axis histogram of difference in normalized magnitude (vertical) and phase (horizontal) between all pairs and that are obtained by Fourier filtration of Ox(r) and Oy(r) to retain only q ∼ Q (SI Text, section 5). This represents the measured distribution of amplitude difference, and phase difference, between each pair of Ox/Oy sites everywhere in the DW. It demonstrates directly that their relative phase is always close to π and that their magnitude differences are always close to zero. (E) Measured R(r) images of local electronic structure patterns that commonly occur in BSCCO and NaCCOC (11). The Cu and Ox sites (labeled by solid and dashed arrows, respectively) were determined independently and directly from topographic images (11). (F) (Left) dFF-DW model with Q = (0.25,0) and amplitude maximum on the central Ox site (dashed arrow). (Right) The calculated density-wave pattern from this model. Therefore, a dFF-DW model with this particular spatial phase provides an excellent explanation for the observed density patterns shown in E and reported previously in refs. 11–13 and 32.

