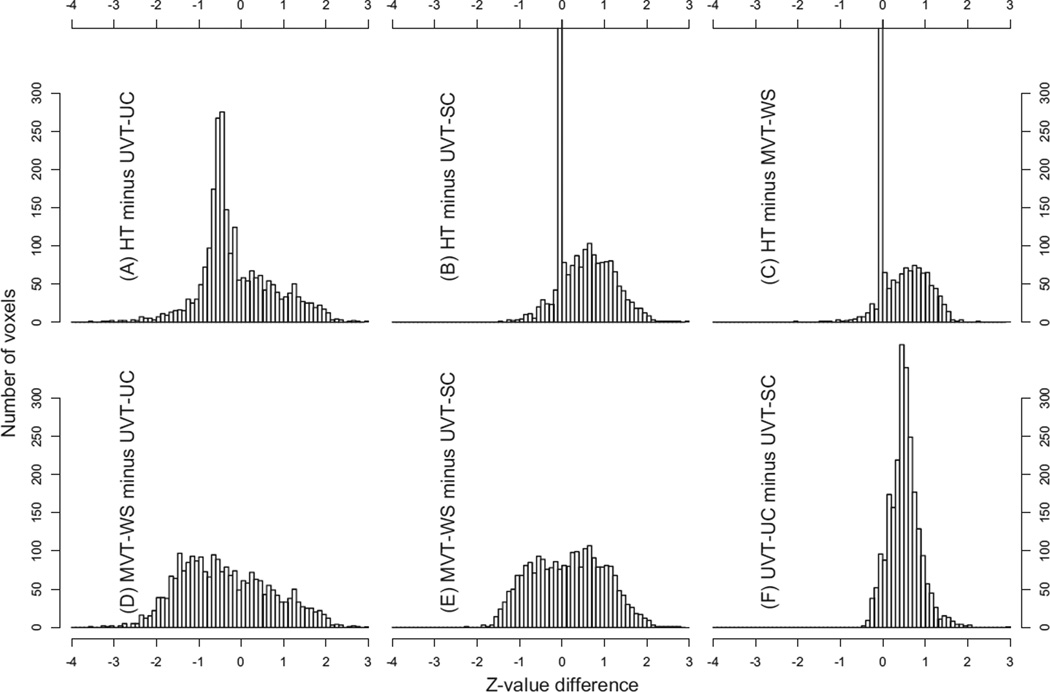
Fig. 2.
Histograms of Z -value differences at 2383 voxels (resolution: 3.5 × 3.5 × 3.5 mm3) that reached the voxel-wise significance level of 0.05 for HT. The Z-values were converted from the original F-values with different degrees of freedom. Six pairwise comparisons are shown: (A) HT and UVT-UC, (B) HT and UVT-SC, (C) HT and MVT-WS, (D) MVT-WS and UVT-UC, (E) MVT-WS and UVT-SC, (F) UVT-UC and UVT-SC. Cell width is 0.1 in Z -value difference. The spikes in (B) and (C), with a height of 958 and 1437 voxels respectively, were chopped off for a comparable representation among the histograms, and they indicate that little difference existed between the two tests at most voxels.

