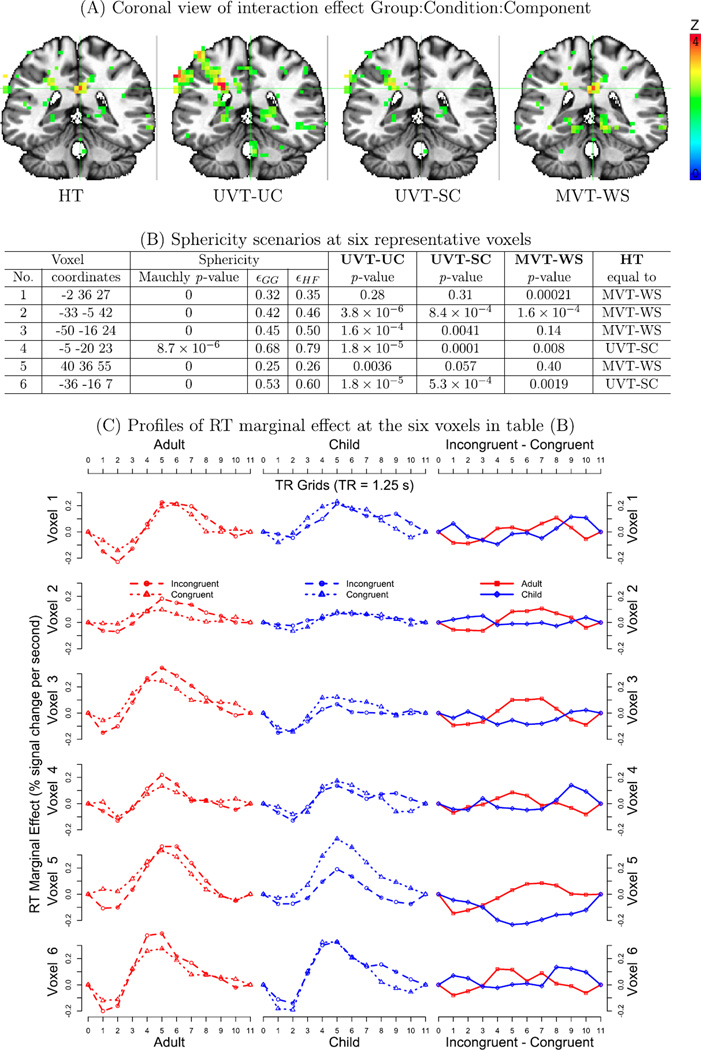
Fig. 3.
(A) Four tests are illustrated on a coronal slice (Z = 27) with colored voxels at the 0.05 level. No multiple testing correction or cluster-level thresholding was applied. Voxel 1 in (B) and (C) is located at the crosshair. The left brain is shown on the right. (B) The Mauchly test, sphericity measures (εGG and εHF) and the four testing statistics are shown at six voxels from the three-way interaction. The extent of sphericity violation is broad among the six voxels. (C) RT marginal effects in condition comparisons (first two columns) and in the three-way interaction are plotted at the six voxels in (B) with each profile spanning over 11 TRs or 13.75 s. In addition to the statistical significance presented in (B), the RT marginal effect profiles of each group at both conditions and the three-way interactions provided strong evidence for the existence of the associated effects at these voxels.

