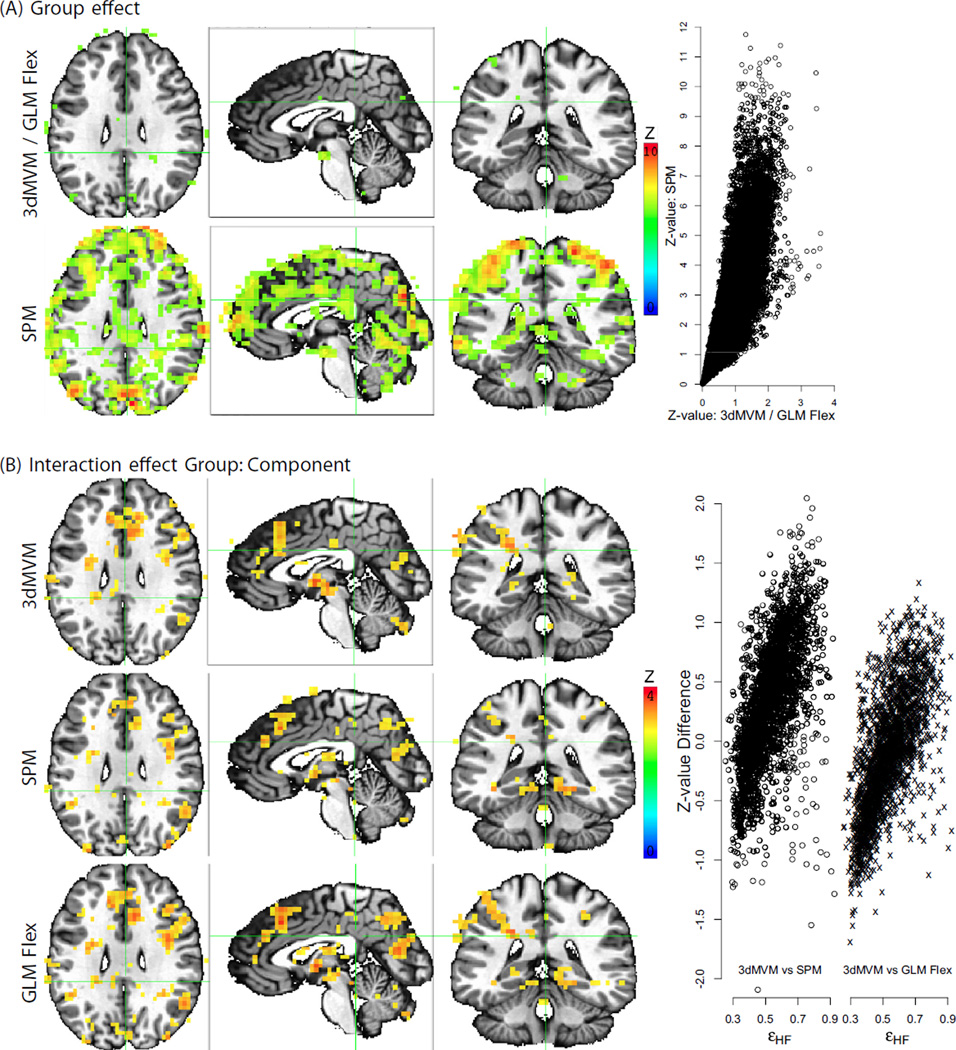
Fig. 5.
Performance comparisons on a two-way ANOVA with one between-subjects (Group) and one within-subject (Component) factor among three modeling strategies: 3dMVM in AFNI, Flexible Factorial Design in SPM (SPM8 v5236), and Matlab package GLM Flex. The original F-statistic values with different degrees of freedom were converted to Z -values for direct comparisons. The color-coded Z -value maps are thresholded at the voxel-wise significance level of 0.05 and shown at the same focus point of (X, Y, Z) = (−2, 36, 27) as in Figs. 3A and 4. (A) 3dMVM and GLM Flex rendered virtually identical group effect while Flexible Factorial Design dramatically inflated the significance due to the incorrect formulation of F-statistic for the between-subjects effect: both the denominator (MSS (A) versus MSBS (A) for factor A in Eq. (7) of Appendix A) and the associated degrees of freedom (432 versus 48) were impropriate. The inflation is also demonstrated in the scatterplot of the Z -values in the brain on the right-hand side. (B) The three programs gave similar interaction effect, but the subtle differences lie in the biases of Flexible Factorial Design and GLM Flex on the significance. UVT-SC was adopted here in 3dMVM for comparisons. As shown in the scatterplot of Z-value differences, the biases at each voxel are positively correlated with the deviation of sphericity violation from the average among the selected voxels. The slight differences between Flexible Factorial Design and GLM Flex were likely due to different selected voxels for the pooling process of the correlation structure.

