
Figure 5.
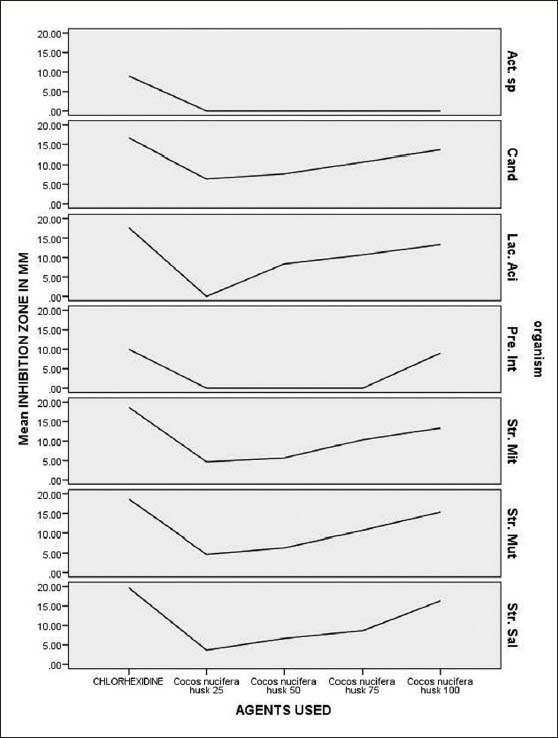
Consolidated graph showing the zone of inhibition created by the alcoholic extract of Cocos nucifera in different concentrations, with respect to different test organisms
Official websites use .gov
A
.gov website belongs to an official
government organization in the United States.
Secure .gov websites use HTTPS
A lock (
) or https:// means you've safely
connected to the .gov website. Share sensitive
information only on official, secure websites.
Consolidated graph showing the zone of inhibition created by the alcoholic extract of Cocos nucifera in different concentrations, with respect to different test organisms