Fig. 4.
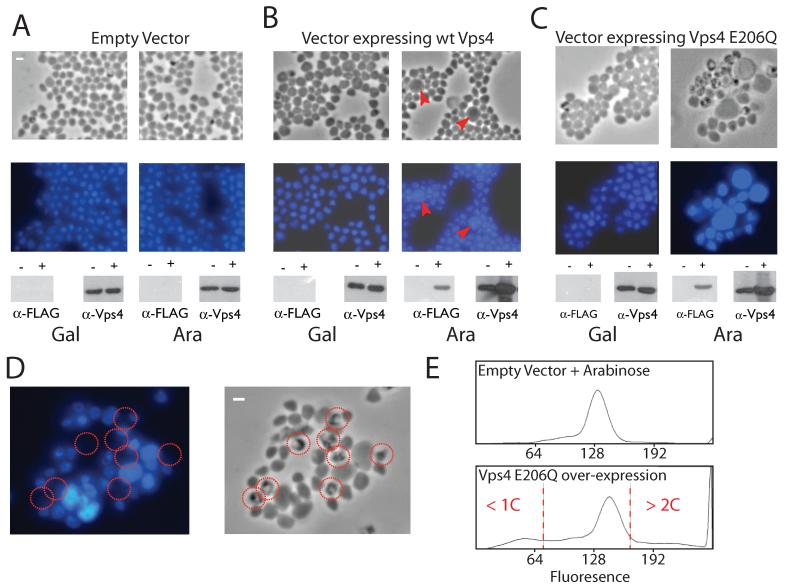
(A to C) Phase contrast and fluorescent microscopy of DAPI stained S. solfataricus cells containing either vector pRYS1 (A), pRYS1-wtVps4 (B) or pRYS1-Vps4 E206Q (C). In each panel, the left-hand images show cells grown in the repressing conditions (in the presence of galactose) and the right-hand images show cells in which expression of the plasmid-encoded gene is induced by the addition of arabinose. Red arrow-heads in (B) indicate enlarged cells with elevated DNA content. The lower panels show the results of western blotting with either antiserum to FLAG or antiserum to Vps4. The antiserum to FLAG detects only the plasmid-encoded Vps4; the antiserum to Vps4 detects both plasmid and chromosomally encoded Vps4. The − and + symbols correspond to cells before and after the addition of either galactose (Gal) or arabinose (Ara).
(D) An enlarged image of cells over-expressing Vps4 E206Q (phase contrast image on the left, fluorescent DAPI image on the right). Cells lacking discernable DAPI staining are circled in red.
(E) Flow cytometric profile of cells grown in arabinose containing either empty vector or vector over-expressing Walker B (E206Q) Vps4. Cells with less than 1C or more than 2C genome content are indicated.

