Figure 2.
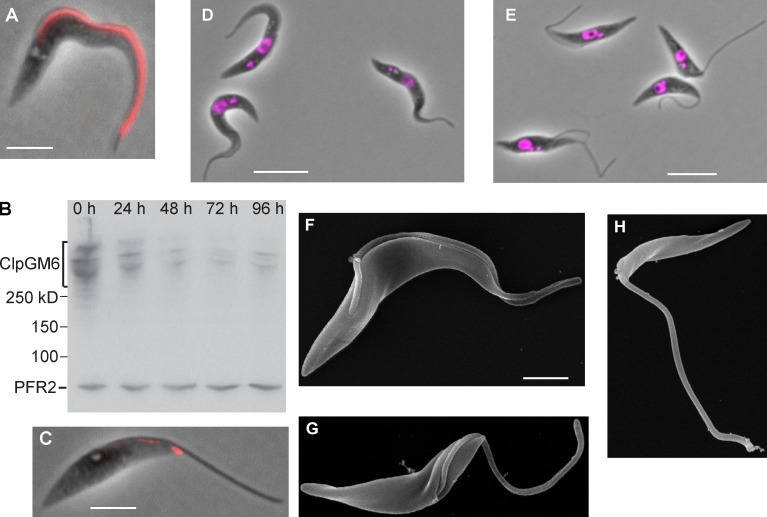
ClpGM6 localization to the FAZ and RNAi phenotype. (A) Phase image of an uninduced T. brucei cell overlaid with the signal of IF staining of the anti-ClpGM6 antibody (red). (B) Western blot of ClpGM6 in T. brucei cells after RNAi induction. Whole-cell lysates of uninduced (0 h) and ClpGM6 RNAi-induced (24–96 h) cells were probed with the anti-ClpGM6 antibody and L8C4, which recognizes a flagellar protein PFR2 and serves as a loading control. (C) Phase image of a 96-h ClpGM6 RNAi-induced cell overlaid with the signal of IF staining of the anti-ClpGM6 antibody (red). (D) Phase image of uninduced cells with trypomastigote morphology overlaid with a fluorescence image of DAPI, which stains DNA. (E) Phase image of 48-h ClpGM6 RNAi-induced cells showing epimastigote-like morphology overlaid with a fluorescence image of DAPI. (F) SEM image of an uninduced trypomastigote. (G) SEM of a ClpGM6 RNAi-induced epimastigote-like cell, in which a large part of the flagellum is not attached to the cell body. (H) SEM of a ClpGM6 RNAi-induced cell, with a flagellum emerging on the cell surface close to the anterior end of the cell. Bars: (A and C) 4 µm; (D and E) 10 µm; (F, applies to G and H) 2 µm.

