Figure 3.
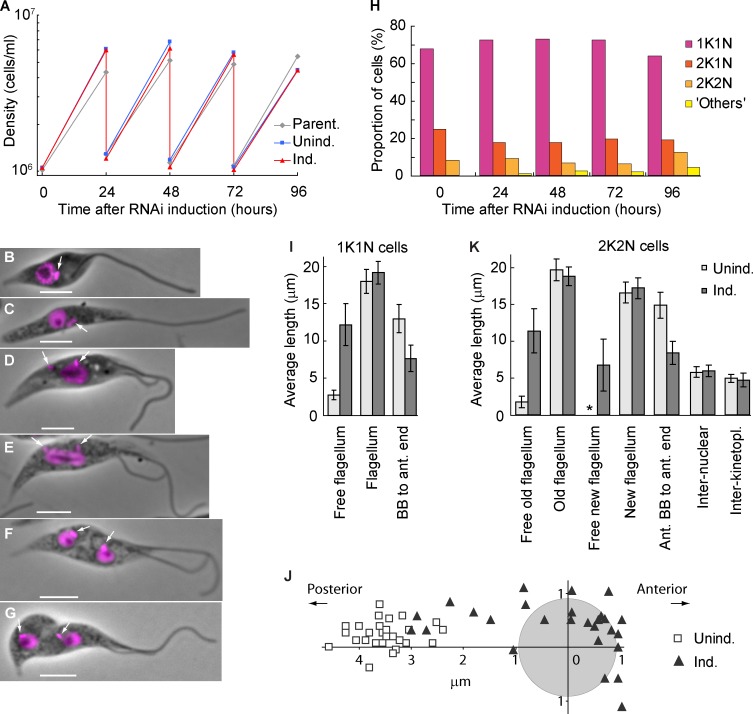
The epimastigote-like phenotype is stable and does not affect proliferation. (A) Growth curves of a parental strain and uninduced and ClpGM6 RNAi-induced cultures. Cell density was measured every 24 h, and the cultures were subsequently diluted to ∼106 cells/ml. The data shown are for a single representative experiment; for another example, see Fig. S1 J. (B–G) Phase images of cell cycle stages of epimastigote-like cells overlaid with fluorescence images of DAPI. Bars, 4 µm. Arrows denote kinetoplasts. (B) 1K1N cell with a single flagellum. (C) 1K1N cell with an elongated dividing kinetoplast. (D) 2K1N cell. The kinetoplast has divided, and one kinetoplast associated with the new flagellum (left) has migrated toward the posterior cell end. The extending new flagellum is attached at its distal tip to the old flagellum. (E) Mitotic cell. The kinetoplast associated with the new flagellum has reached its final position. The mitotic spindle has formed, segregating the DNA and elongating the nucleus. (F) 2K2N postmitotic cell. The kinetoplast and the nucleus have divided and reached their final positions in the cell. (G) 2K2N cell in cytokinesis. The cleavage furrow is proceeding from the anterior end of the cell. (H) Proportions of cells in various cell cycle stages at different times of ClpGM6 RNAi induction. n = 500 cells. (I) Morphometric measurements of uninduced (Unind.; n = 28) and 72-h ClpGM6 RNAi-induced (Ind.; n = 27) 1K1N cells. Error bars denote SDs. (J) Kinetoplast–nucleus position in 28 uninduced trypomastigote cells and 27 ClpGM6 RNAi-induced cells at various stages of transition from trypomastigote to epimastigote-like morphologies. The center of the coordinates is relative to the center of the nucleus (gray circle). The x axis is parallel to the anterior–posterior cell axis. (K) Morphometric measurements of uninduced (n = 17) and ClpGM6 RNAi-induced (n = 25) 2K2N cells. Error bars denote SDs. The asterisk shows insignificant free new flagellum length present in uninduced cells. For more morphometric measurements of 1K1N and 2K2N cells, see Table S1 and Table S2.

