Figure 5.
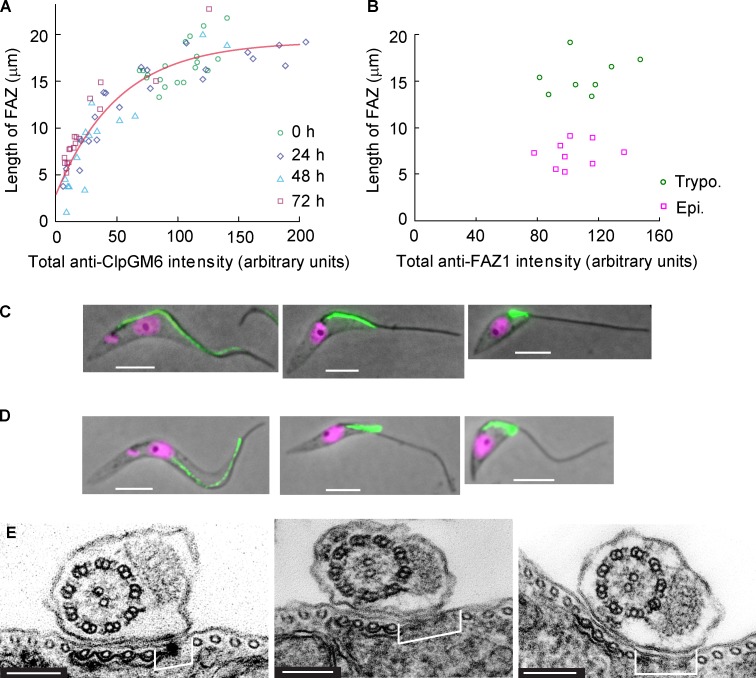
FAZ length correlates with amount of ClpGM6 but not with amount of FAZ filament constituents. (A) A plot of the length of the FAZ versus the total anti-ClpGM6 staining intensity in the FAZ. Each data point represents a single 1K1N cell. Circles, 19 uninduced cells; diamonds, 21 cells with ClpGM6 RNAi induced for 24 h; triangles, 15 cells with ClpGM6 RNAi induced for 48 h; squares, 18 cells with ClpGM6 RNAi induced for 72 h. The red line denotes a fit by an exponential function, which approaches the plateau value of 19.2 µm and intercepts the y axis at 2.9 µm. (B) A plot of the length of the FAZ versus the total anti-FAZ1 staining (L6B3 antibody) intensity in the FAZ. Each data point represents a single 1K1N cell. Circles, eight uninduced trypomastigote (Trypo.) cells; squares, nine ClpGM6 RNAi-induced epimastigote-like (Epi) cells. (C) 1K1N cells stained with the L6B3 antibody recognizing FAZ1 in the FAZ filament. Phase images of an uninduced cell (left) and ClpGM6 RNAi-induced cells overlaid with the IF signal of L6B3 (green) and the fluorescence signal of DAPI (magenta). (D) 1K1N cells stained with the DOT1 antibody recognizing the FAZ filament. Phase images of an uninduced cell (left) and ClpGM6 RNAi-induced cells overlaid with the IF signal of DOT1 (green) and the fluorescence signal of DAPI (magenta). (E) TEM images of the FAZ region in an uninduced cell (left) and two cells with ClpGM6 RNAi induced for 72 h, illustrating that in induced cells, the electron-dense FAZ filament (brackets) is wider than in uninduced cells. Bars: (C and D) 4 µm; (E) 150 nm.

