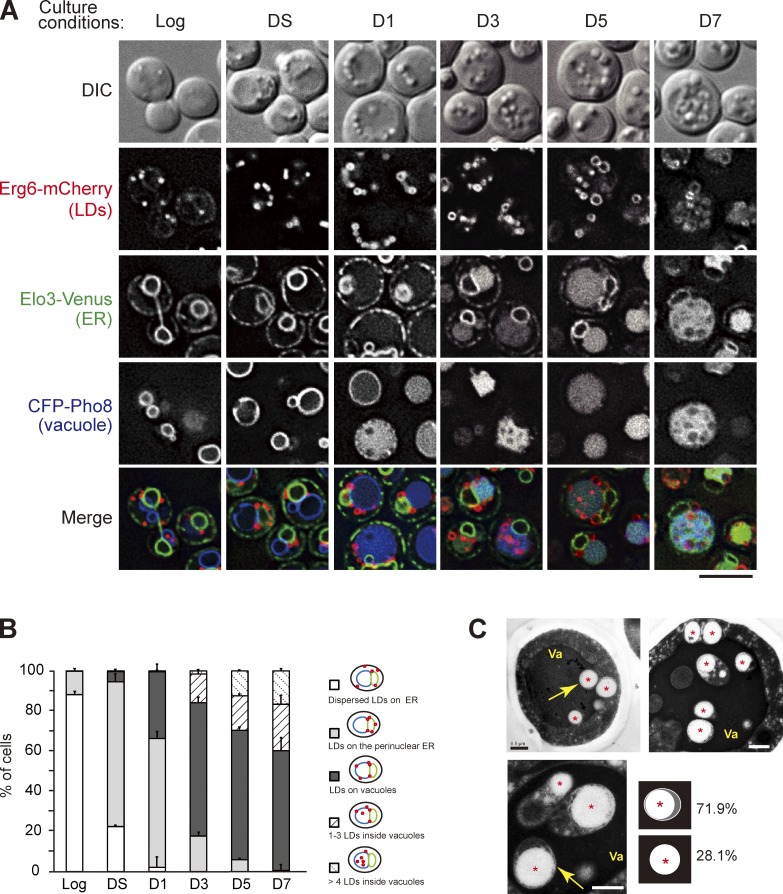
Figure 1.
The dynamics of LDs during transition to stat-phase. (A) Cells expressing the indicated proteins grown in SC medium to log phase, diauxic shift (DS), or the indicated days after log phase (D1–D7) were subjected to fluorescence microscopy. DIC, differential interference contrast. Bar, 5 µm. (B) Quantification of data in A for the indicated localization patterns from three independent experiments was plotted as mean ± SD. (C) The thin-sectioned EM pictures of wild-type cells grown in SC medium to D4. Va, vacuole. Asterisks show LDs. Bars, 0.5 µm. Yellow arrows indicate the LDs in the vacuole lumen. The LDs (n = 96) inside the vacuole lumen with or without outer membranes as depicted were quantified, and the percentage is shown.

