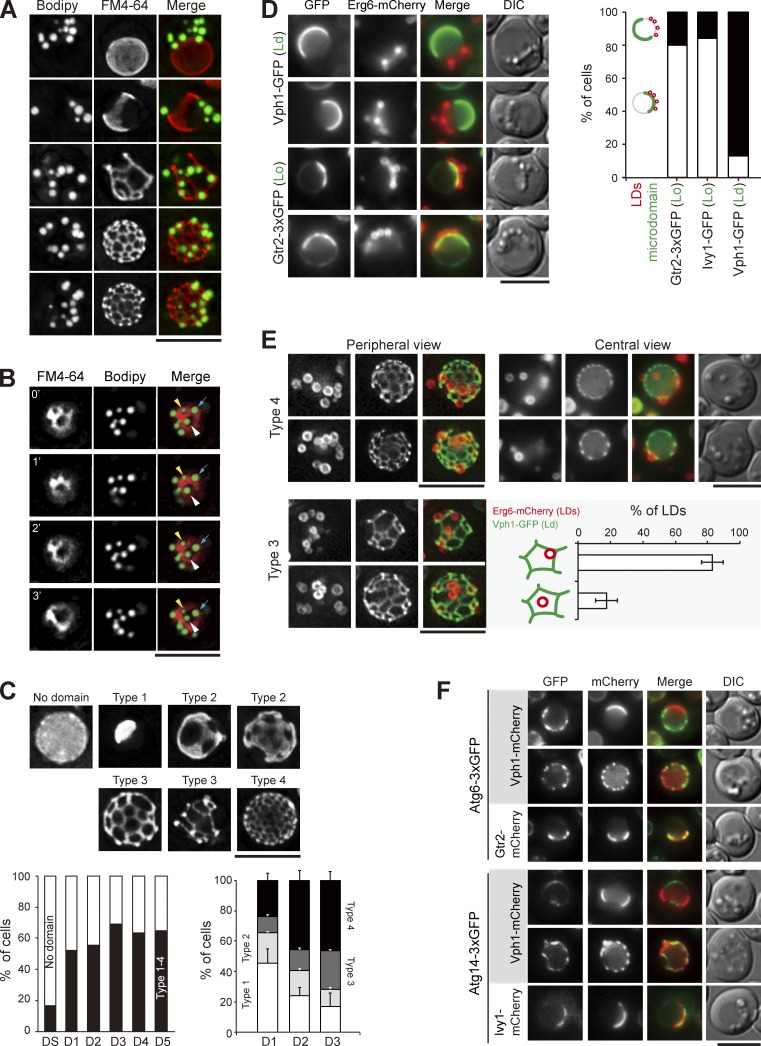
Figure 3.
LDs associate with the sterol-enriched vacuolar microdomain Lo. (A) Wild-type cells stained with FM4-64 (vacuole) and BODIPY (LDs) were imaged by fluorescence microscopy. Images were processed by deconvolution followed by maximal projection. (B) Same as A, except that the images were acquired by a time interval of every 1 min. The yellow and white arrowheads and blue arrows define three independent LDs. (C) Cells expressing Vph1-mCherry were imaged and processed as in A. Representative images of various Vph1-mCherry patterns are shown. The plots show quantification of these patterns under various growth conditions. (left) The data shown are from a single representative experiment (n > 200 for each indicated condition) out of three repeats. (right) The data shown are from three independent experiments and plotted as mean ± SD. (D) Cells expressing Erg6-mCherry (LDs) and microdomain (Ld or Lo) markers as indicated were imaged by fluorescence microscopy on D1. LDs and microdomain patterns as indicated were quantified and plotted. The data shown are from a single representative experiment (n > 60 for each cell type) out of three repeats. (E) Cells expressing Erg6-mCherry and Vph1-GFP were imaged for periphery and center on D3. The localization of types 3 and 4 of Vph1-GFP patterns were compared. The LDs in type 3 images were further quantified based on the two indicated patterns from three independent experiments. Error bars show mean ± SEM. (F) Cells expressing proteins as indicated were imaged by fluorescence microscopy. DIC, differential interference contrast. Bars, 5 µm.

