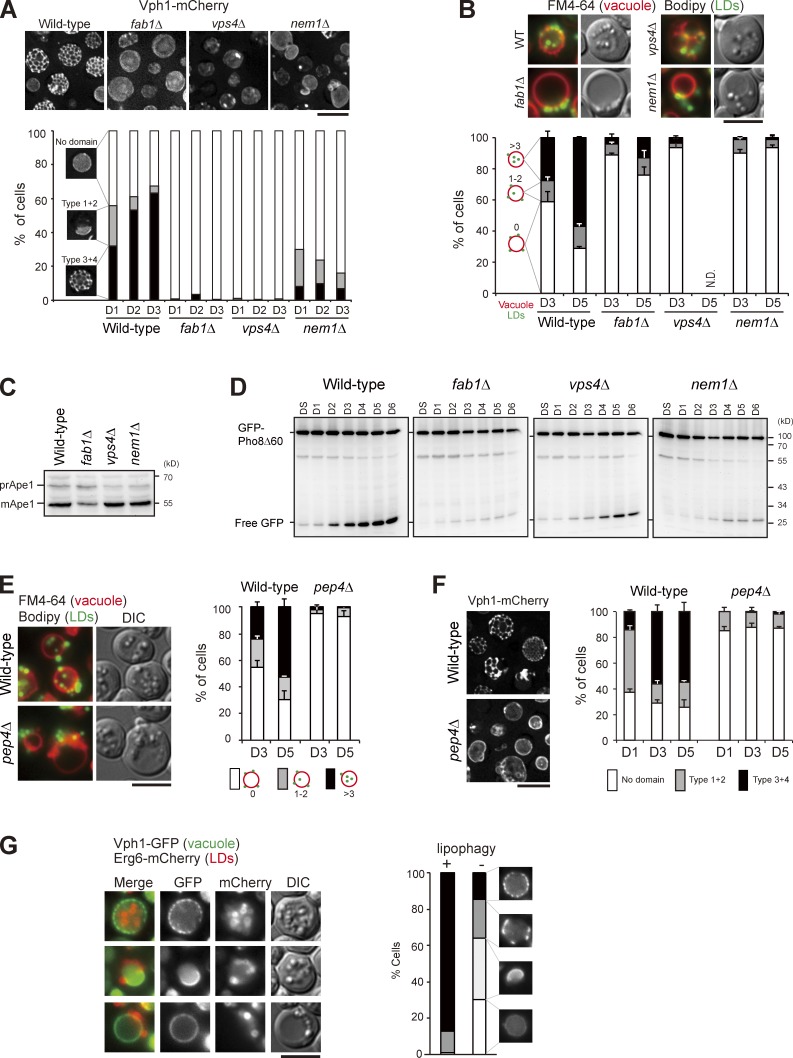
Figure 4.
Vacuolar microdomain organization is crucial for stat-phase lipophagy. (A) Cells as indicated expressing Vph1-mCherry were imaged by fluorescence microscopy, and data were quantified based on the three indicated patterns. The data shown are from a single representative experiment (n > 200 for each condition) out of three repeats. (B) Cells as indicated stained with FM4-64 (vacuole) at DS and BODIPY (LDs) on D3 were imaged by fluorescence microscopy. Data were quantified based on the indicated patterns and plotted as mean ± SD from three independent experiments. WT, wild type. (C) Cells as indicated grown in SC medium were shifted to SD-N for 3 h. Cells were lysed, and the lysates were analyzed by immunoblotting with the anti-Ape1 antibody. pr, precursor; m, mature. (D) Cells expressing GFP-Pho8Δ60 under growth conditions as indicated were lysed, and the lysates were analyzed by immunoblotting with the anti-GFP antibody. (E) Same as B, except that wild type and pep4Δ were compared. (F) Same as A, except that wild type and pep4Δ were compared. Error bars show mean ± SEM from three experiments. (G) Cells expressing Vph1-GFP and Erg6-mCherry were imaged by fluorescence microscopy on D4. The indicated patterns of Vph1-GFP were quantified in cells with (+) and without (−) Erg6-mCherry inside vacuole lumen (lipophagy). The data shown are from a single representative experiment (n > 80 for each condition) out of three repeats. DIC, differential interference contrast. Bars, 5 µm.

