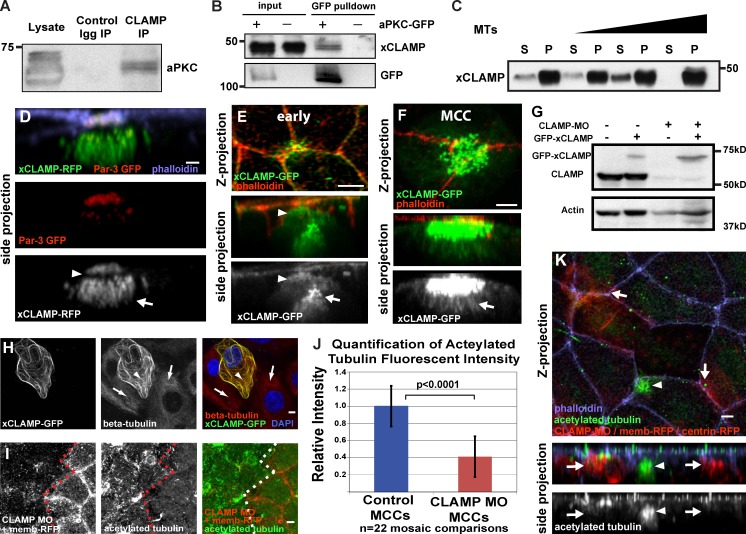
Figure 3.
CLAMP interacts with aPKC and stabilizes MTs. (A) Western blot of a coimmunoprecipitation using anti-CLAMP mAb probed with anti-aPKC antibody. (B) Western blot probed with anti-CLAMP mAb of a GFP pull-down using NHS-GFP beads with wild-type lysates (−) or lysates from embryos expressing aPKC-GFP (+). (C) Western blot using anti-CLAMP mAbs of an MT pelleting assay with recombinant GST-tagged CLAMP. S, supernatant fraction; P, pellet. MT concentrations are 0, 0.3, 1.2, and 2.4 µM. (D and E) Localization of CLAMP to the leading edge (arrowheads) colocalized with Par3-GFP (D) and to the centriole cluster (arrows). (F) Image highlighting CLAMP localization to the apical surface and to the associated MTs (arrow). (G) Western blot using anti-CLAMP mAb on lysates from control embryos (lane 1) and embryos injected with GFP CLAMP (lanes 2 and 4) and CLAMP MO (lanes 3 and 4). (H) Staining with anti–β-tubulin and DAPI of RPE-1 cells expressing xCLAMP-GFP (arrowheads) compared with neighboring non-CLAMP-expressing cells (arrows) after cold-induced MT depolymerization. (I) Acetylated MT staining in mosaic embryos with CLAMP morphant OCs marked with membrane-RFP. (J and K) Quantification (J) and representative image (K) of acetylated MT staining during intercalation in mosaic embryo CLAMP morphant MCCs (arrows), and wild-type MCCs (arrowheads). Membrane-RFP and centrin-RFP were injected to identify CLAMP MO–containing MCCs. The distinct staining pattern of acetylated tubulin in MCCs allows for the differentiation control MCCs from other intercalating cell types. Quantification in J is statistically significant (P < 0.0001, t test). Error bars represent standard deviations. See Fig. S2. Bars, 5 µm.

