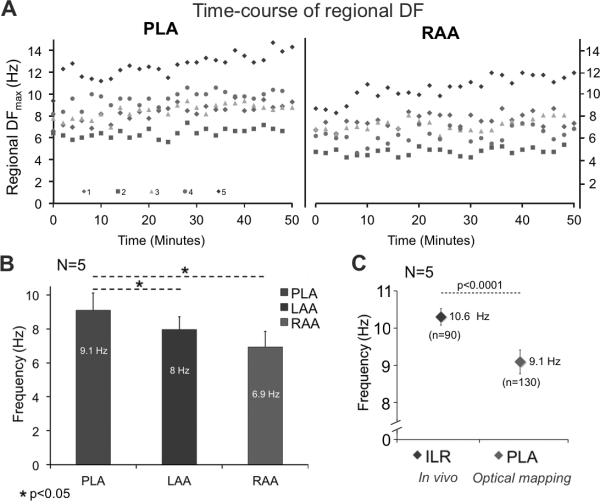
Figure 4.
A) Time-course of DF in 5 isolated hearts over a 50 min period (each color represents one heart). The DFmax was consistently localized in the PLA. B) Statistically significant DF gradient from PLA to LAA-RAA. C) In-vivo mean DFmax from the ILR was significantly different from mean DFmax at the PLA (10.6±0.1 vs. 9.1±0.2 Hz. p<0.0001). `N' represents the number of animals and `n' the total number of measurements.

