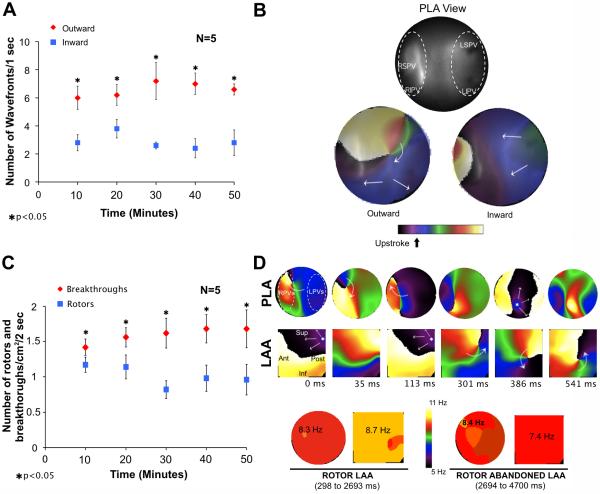
Figure 5.
Patterns of activation in the PLA of isolated hearts during AF. A) The graph shows that the number of outwardly propagating wavefronts/sec was significantly larger than the number of inwardly propagating wavefronts/sec. B) Top, optical field on the endocardium of the PLA; bottom, snapshots of phase movies showing a rotor generating outwardly propagating waves (left). An inwardly propagating wave is shown on the right. C) The number of breakthroughs/cm2/2-sec is higher than the number of rotors/cm2/2-sec. D) Top, snapshots from a phase movie show a rotor appearing in the field of view of the LAA. The patterns of activation switch from breakthroughs (0-to-113 ms) to a meandering rotor (301-to-541 ms). Bottom, the DFmax is in the LAA when the rotor stays in the field of view and go back to PLA when the rotor drifts outside the LAA.

