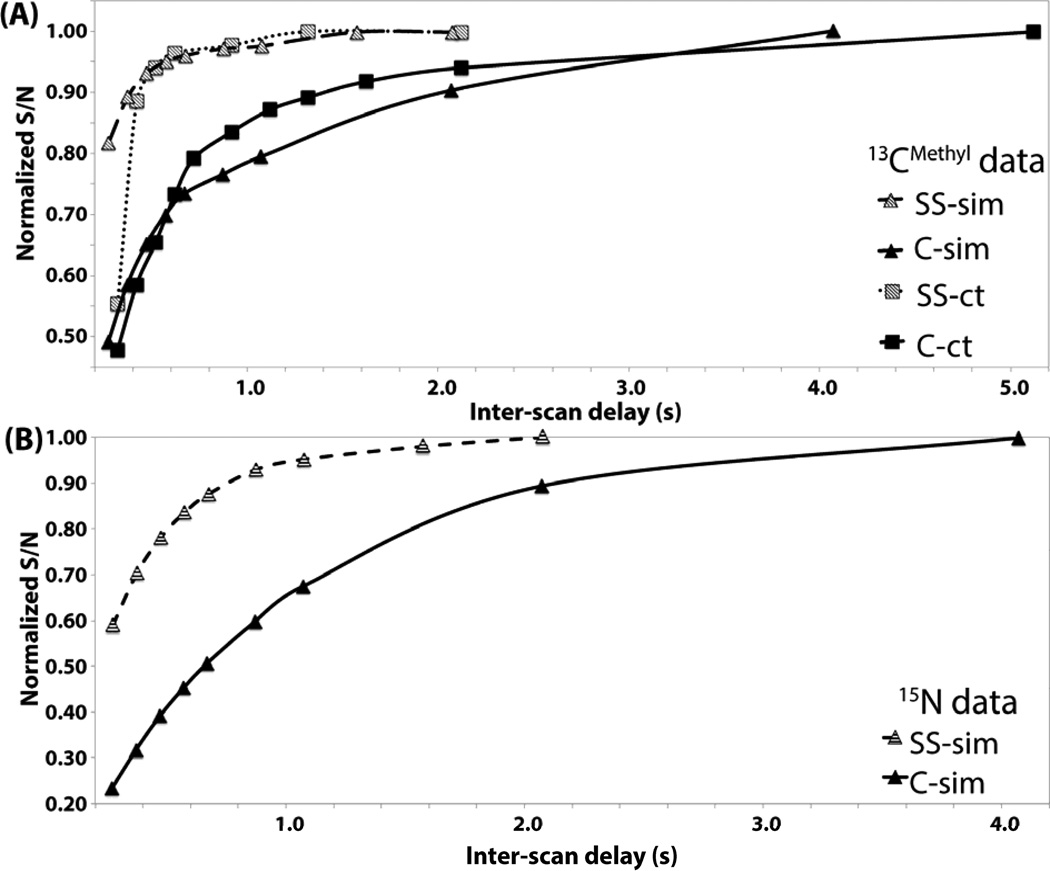
Figure 6.
Average S/N ratios measured for signals in spectra recorded for protein ubiquitin were normalized by dividing them with the S/N ratio observed at very long delays between the acquisition of FIDs (‘inter-scan delays’) and then plotted versus the inter-scan delay. Data points for SS and conventional HMQC are represented, respectively, by grey and black symbols as shown in the lower right (‘SS’ and ‘C’ denote SS and conventional HMQC) and connected by lines. (A) Methyl signals. (B) Polypeptide backbone amide signals.

