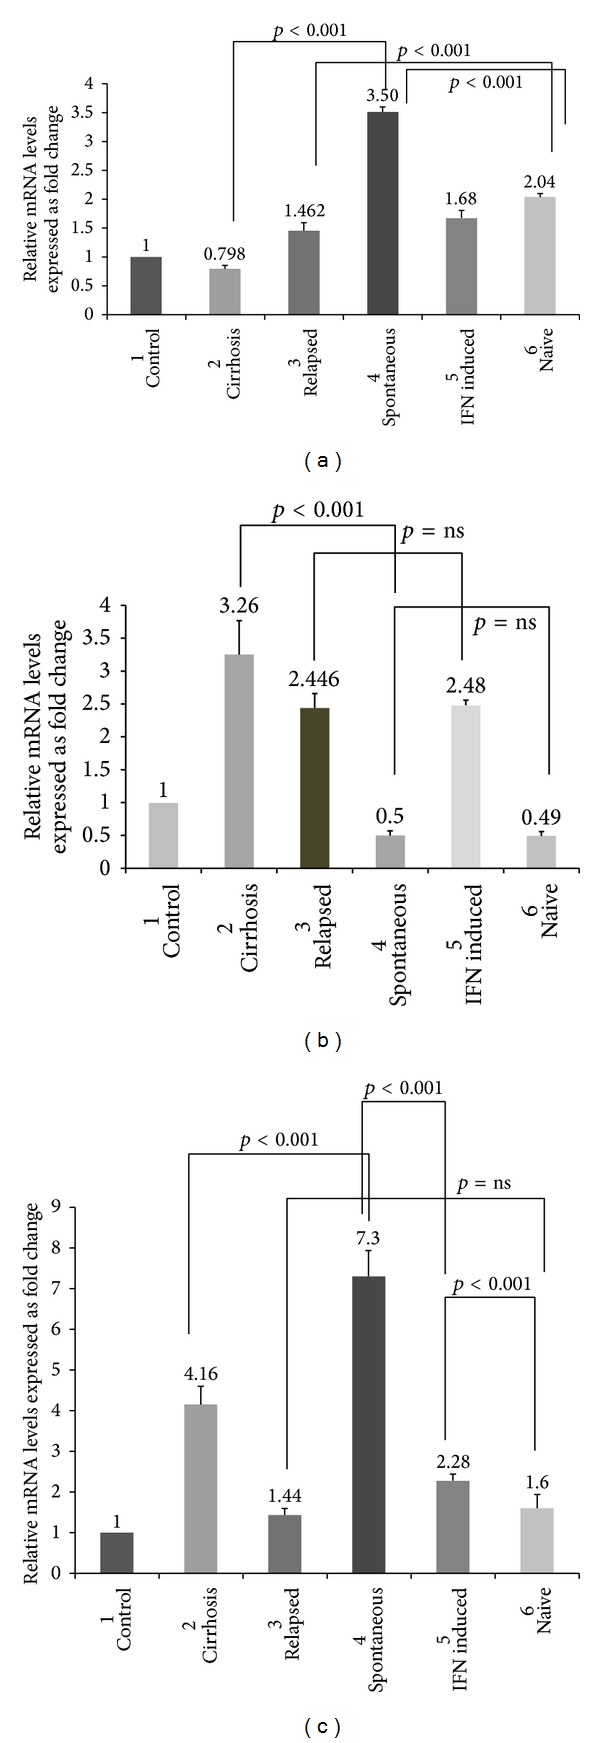
Figure 1.

(a) Comparison of mRNA expression levels of TLR 3 expression within different stages of HCV infected population. p values ≤ 0.05 are considered to be statistically significant and ns: statistically nonsignificant. (b) Comparison of mRNA expression levels of TLR 7 expression within different stages of HCV infection population. p values ≤ 0.05 are considered to be statistically significant and ns: statistically nonsignificant. (c) Comparison of mRNA expression levels of TLR 8 expression within different stages of HCV infected population. p values ≤ 0.05 are considered to be statistically significant and ns: statistically nonsignificant.
