Figure 1.
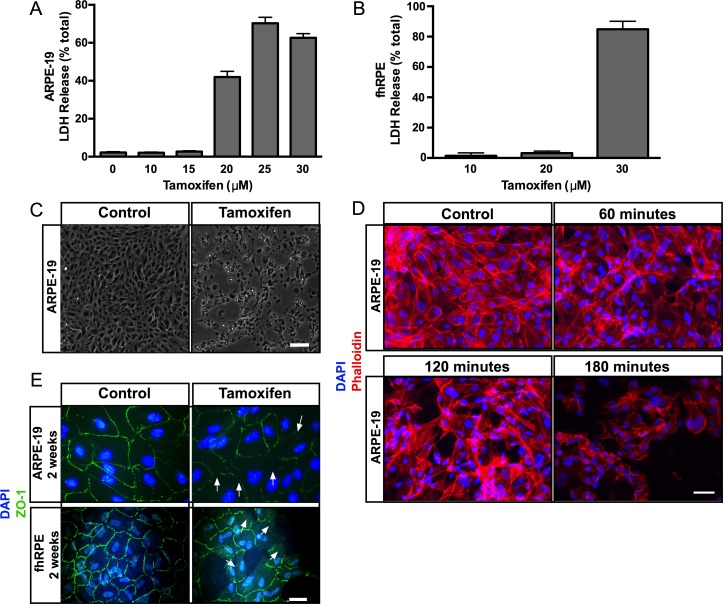
Tamoxifen induces cytotoxicity in ARPE-19 and fhRPE cells. Increasing doses of tamoxifen treatment led to an increase in LDH release in (A) ARPE-19 cells, and (B) in fhRPE cells. (C) Light micrographs of control and tamoxifen-treated ARPE-19 cells. Cells exposed to tamoxifen (right) appear round and show patches of cell loss when compared with controls (left). Scale bar: 200 μm. (D) Phalloidin staining (red) of control cells (top left) shows normal actin cytoskeletal organization, and DAPI staining reveals the nuclei (blue). Progressive loss of actin cytoskeletal organization was observed with 60, 120, and 180 minutes of tamoxifen treatment (top right and bottom). Scale bar: 25 μm. (E) Immunofluorescence micrographs demonstrated normal hexagonal arrangement of the tight junction protein ZO-1 (green) in control ARPE-19 and fhRPE cells (left, top and bottom); tamoxifen-treated ARPE-19 and fhRPE cells show disruption and loss of ZO-1 staining (arrows at right top and bottom). Scale bar: 25 μm. Error bars: ±SEM.

