
Figure 5.
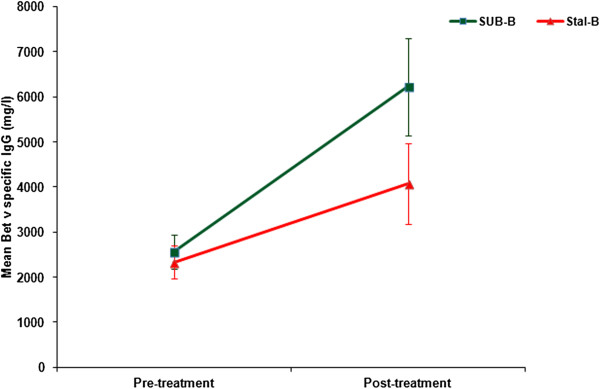
Bet v specific IgG levels (including standard error) before and after SLIT treatment. Bet v specific IgG levels increased in both groups, the increase in the SUB-B groups was significantly higher than in the Stal-B group (p = 0.03).
Official websites use .gov
A
.gov website belongs to an official
government organization in the United States.
Secure .gov websites use HTTPS
A lock (
) or https:// means you've safely
connected to the .gov website. Share sensitive
information only on official, secure websites.
Bet v specific IgG levels (including standard error) before and after SLIT treatment. Bet v specific IgG levels increased in both groups, the increase in the SUB-B groups was significantly higher than in the Stal-B group (p = 0.03).