
Figure 5.
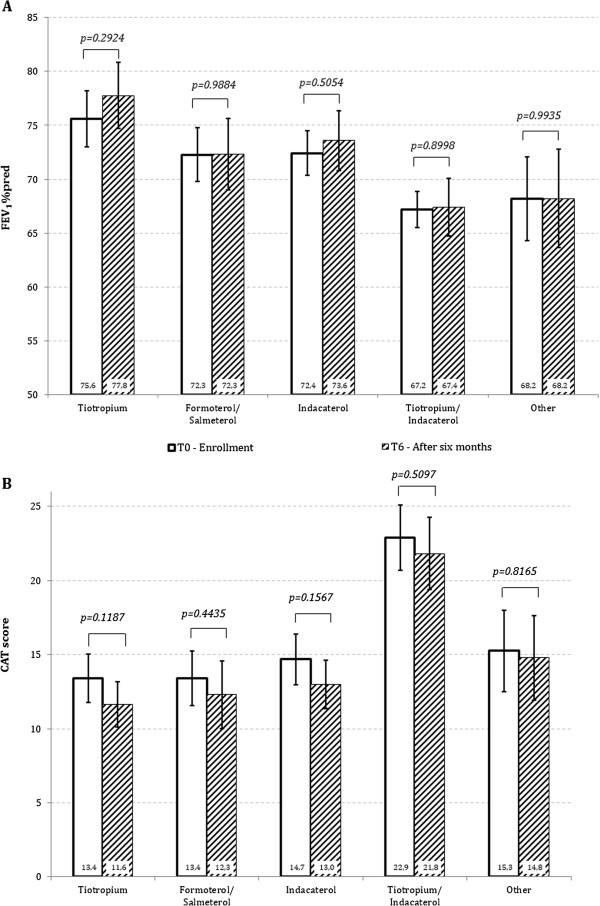
Mean (SE) of FEV 1 % predicted (A) and of CAT score (B) at T0 and T6 in the different groups of treatments (NO ICS).
Official websites use .gov
A
.gov website belongs to an official
government organization in the United States.
Secure .gov websites use HTTPS
A lock (
) or https:// means you've safely
connected to the .gov website. Share sensitive
information only on official, secure websites.
Mean (SE) of FEV 1 % predicted (A) and of CAT score (B) at T0 and T6 in the different groups of treatments (NO ICS).