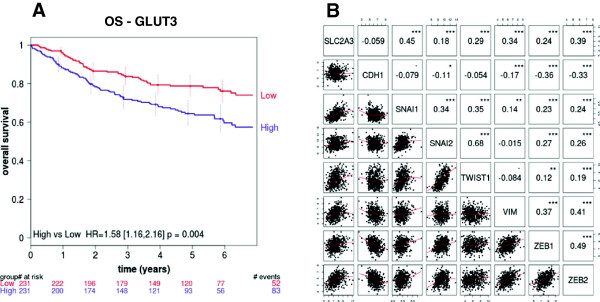
Figure 6.

GLUT3 expression correlates with poor overall survival and EMT in human NSCLC. (A) Kaplan-Meier plot representing overall survival comparing tumor samples with high or low GLUT3 levels. The numbers of living patients are indicated for each year and group. HR hazard ratio, OS overall survival. (B) The correlations between each of GLUT3 (SLC2A3), E-cadherin (CDH1), SNAIL (SNAI1), SLUG (SNAI2), Twist (TWIST1), vimentin (VIM), ZEB1, and ZEB2 were assessed from the pooled dataset. Spearman correlation coefficients (indicated numbers) were calculated between the expression values of each pair. 0.1 < P < 0.05; *P < 0.05; **P < 0.01; ***P < 0.001.
