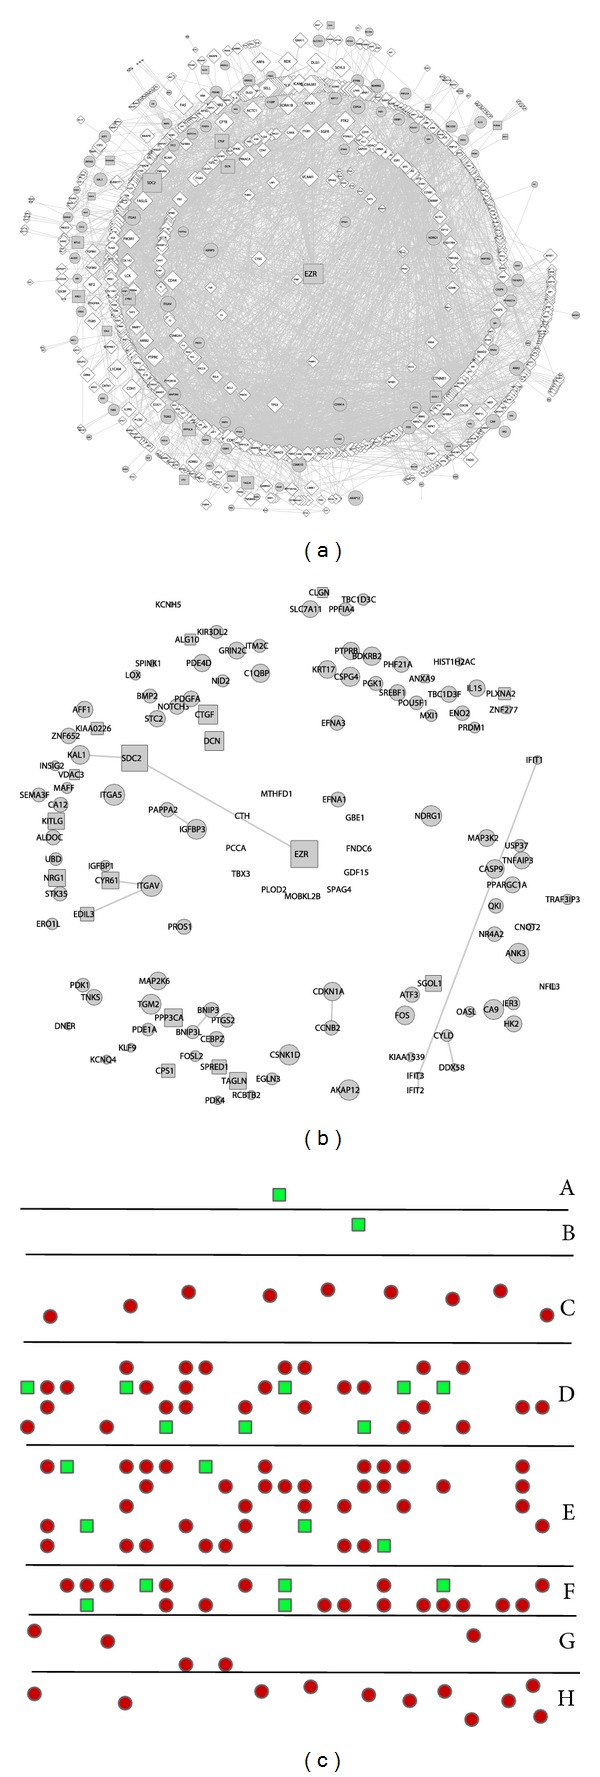
Figure 5.

Prioritization analysis of DEGs in the total DEGs PPI subnetwork. (a) The size of each node in the PPI subnetwork was designed in a gradient based on the scores. (b) The DEGs were extracted from (a) to show their size. (c) The DEGs were rearranged according to their closeness to EZR protein.
