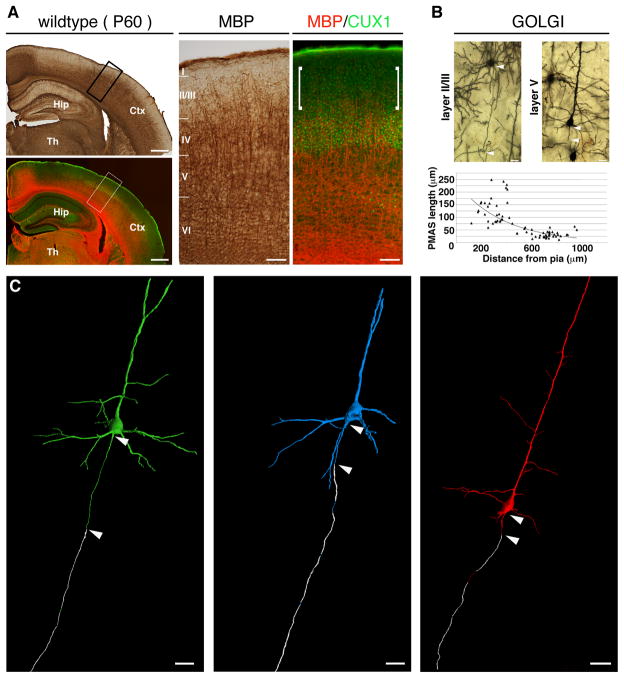
Fig. 1. Radial distribution of myelin in the adult mouse neocortex.
(A) Immunohistochemical staining of MBP and CUX1 in coronal sections of wild type adult neocortex. High magnifications of boxed areas show reduced levels of myelin in layer II/III (brackets). (B) PMAS lengths (arrowheads) in Golgi-Cox-labeled adult wild type cortex. Top, representative neurons in layer II/III and layer V. Bottom, scatter plot of PMAS length versus distance of neuronal cell bodies from the pia (n=72, R2= 0.61093). (C) 3D renderings of three representative neurons. The green and blue neurons were located in layer III–IV and the red neuron was in layer V. Myelin is shown in white. Ctx, cortex; Hip, hippocampus, Th, thalamus. Scale bars, 500 μm (A, low magnification), 100 μm (A, insets), 20 μm (B), 25 μm (C).

