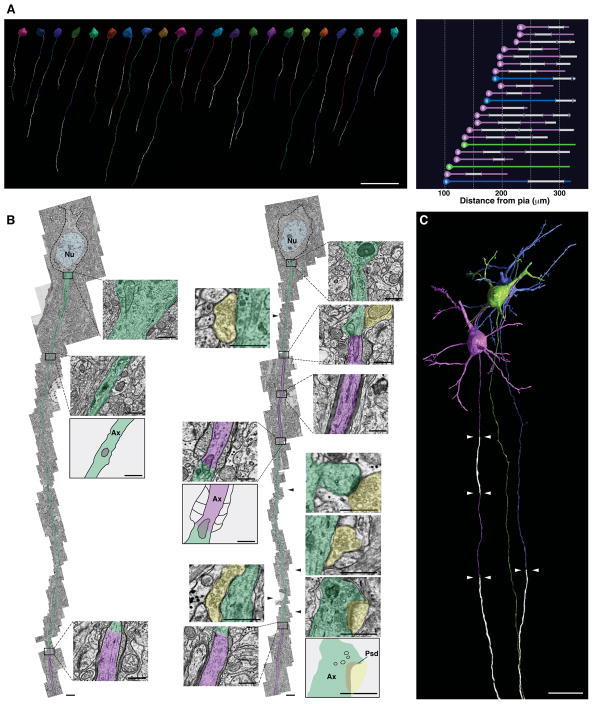
Fig. 2. Layer II/III pyramidal neurons display novel profiles of longitudinal myelination including intermittent myelin.
(A) High-resolution rendering of myelin distribution along single axons of 22 pyramidal neurons traced and reconstructed in layer II/III of the V1 dataset. Right panel, soma position and lengths of axonal tracts for all neurons rendered in left panel. Magenta, neurons with intermittent myelin; blue, neurons with long PMAS; green, neurons with unmyelinated axons; white, myelinated axonal segments. (B) Representative, serial EM reconstructions of neurons with long PMAS (left) or intermittent myelin (right). Unmyelinated axon tracts are highlighted in green and myelinated tracts in magenta. Insets, EM images and schematic representations of selected regions from each axon. Yellow, selected synapses mapped on the intermittently myelinated axon. Ax, axon; Nu, nucleus, Psd, post-synaptic density. (C) High-resolution rendering of three representative neurons displaying different myelination modes. Native positions of these neurons are preserved in the rendering. Arrowheads mark the boundaries of myelinated tracts (white). Scale bars, 50 μm (A), 2 μm (B), 0.5 μm (B, insets), 20 μm (C).

