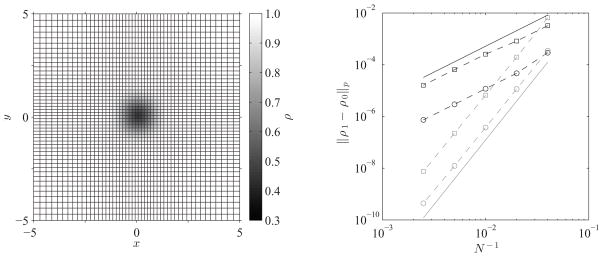
Figure 4.
Plots of the density at t = 0, ρ0, on the coarsest nonuniform grid, 25 × 25 cells (left) and p-norm of the error between the density at t = 0 and t = 1, ρ1, as a function of the grid size, N × N (right), for the stationary isentropic vortex problem given by Eq. (37). The grid convergence of the L1- and L∞-norm is shown for both when the primitive variables are reconstructed at the cell boundaries from their second-order accurate cell averages (–
 – and –
 –, respectively), following Johnsen and Colonius [30], and their fourth-order accurate cell averages (–
 – and –
 –, respectively), following the present scheme. Reference slopes for the second-order (—) and fifth-order (—) convergence rates are also included.

