Figure 4.

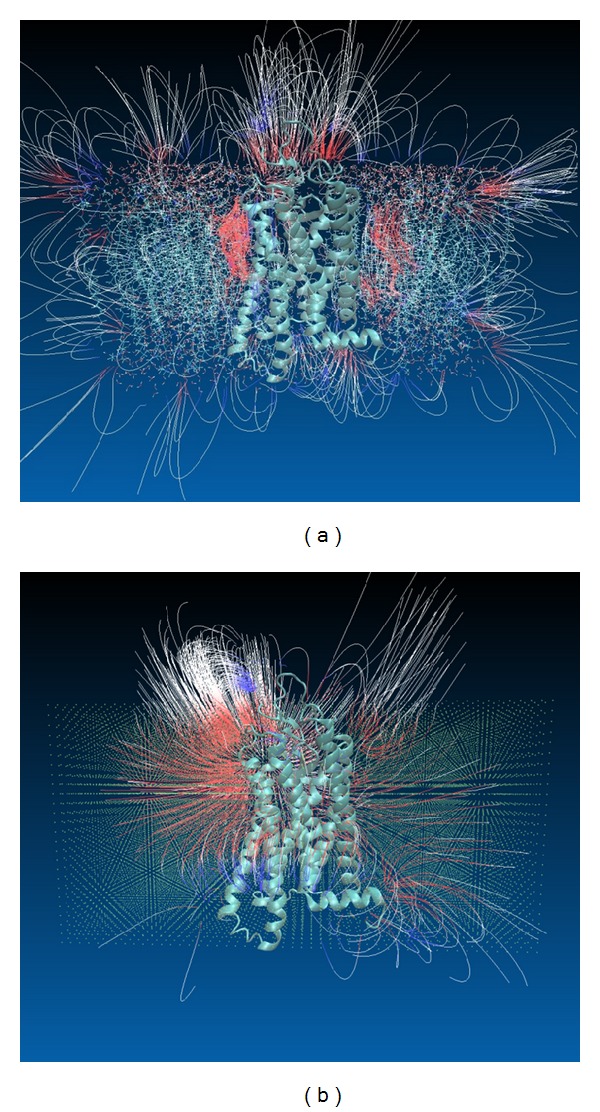
The electrostatic field lines generated with VMD for potential map calculated with DelPhi for explicit and implicit membranes. Color codes are −0.5 and +0.5 for red and blue, respectively. (a) Explicit membrane, (b) implicit membrane.

The electrostatic field lines generated with VMD for potential map calculated with DelPhi for explicit and implicit membranes. Color codes are −0.5 and +0.5 for red and blue, respectively. (a) Explicit membrane, (b) implicit membrane.