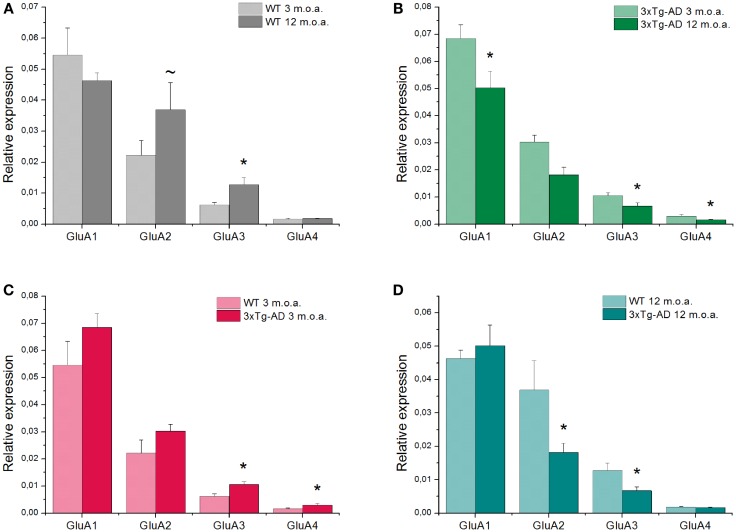
Figure 1.
Quantitative real-time PCR analysis of GluA1–4 genes is shown. Graph bars depict mean expression levels of GluA1–4 relative to the internal reference. (A) Comparison between 12 m.o.a (old) vs. 3 m.o.a (young) animals WT mice showed an increase in GluA3 expression level (*p = 0.004). A trend toward increased levels of GluA2 expression was also found (~p = 0.073). (B) Comparison between old vs. young mice 3xTg-AD animals showed decreases in GluA1, 3, and 4 expression levels (*p = 0.045; *p = 0.047; *p = 0.011, respectively). (C) In AD mice, comparison between 3xTg-AD mice vs. WT mice at 3 m.o.a. showed increases in GluA3 (*p = 0.039) and GluA4 (*p = 0.030) expression levels. (D) Comparison between 3xTg-AD mice vs. age-matched WT mice showed a decrease in GluA2 (*p = 0.038) and GluA3 (*p = 0.005) expression levels in the 3xTg-AD animals. Data are expressed as mean values ± SEM obtained from six mice in each study group. P value is the result of two-factor ANOVA and Fisher’s least significant difference (LSD) post hoc test (*p < 0.05; ~trend 0.05 < p < 0.1).

