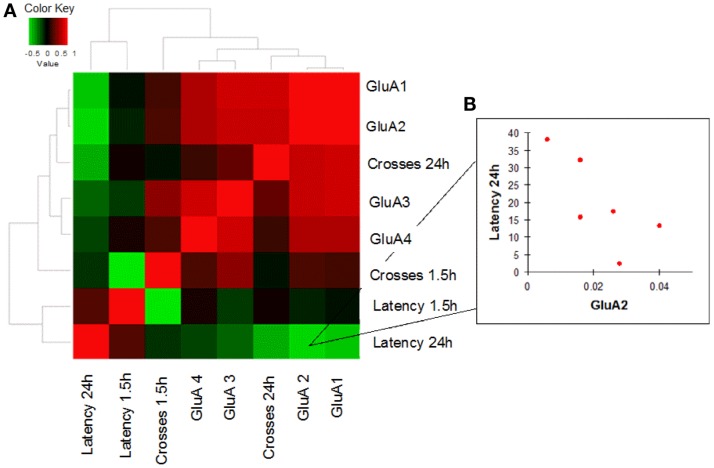
Figure 4.
Correlation analysis between GluA1–4 expression levels and MWM cognitive performances of WT mice is shown. (A) Heatmap shows Spearman’s correlations between GluA1–4 expression levels (2−ΔCt) and MWM parameters (latency and crosses) in young WT mice. Direct and inverse correlations are shown in red and green, respectively. (B) WT mice showed an inverse correlation between GluA2 and MWM latency at 24 h.

